Quantcast
Channel: KNIME news, usage, and development
Viewing all 561 articles
Browse latest View live

Guided Labeling Blog Series - Episode 5: Blending Knowledge with Weak Supervision

$
0
0
Guided Labeling Blog Series - Episode 5: Blending Knowledge with Weak SupervisionpaolotamagThu, 07/09/2020 - 10:00

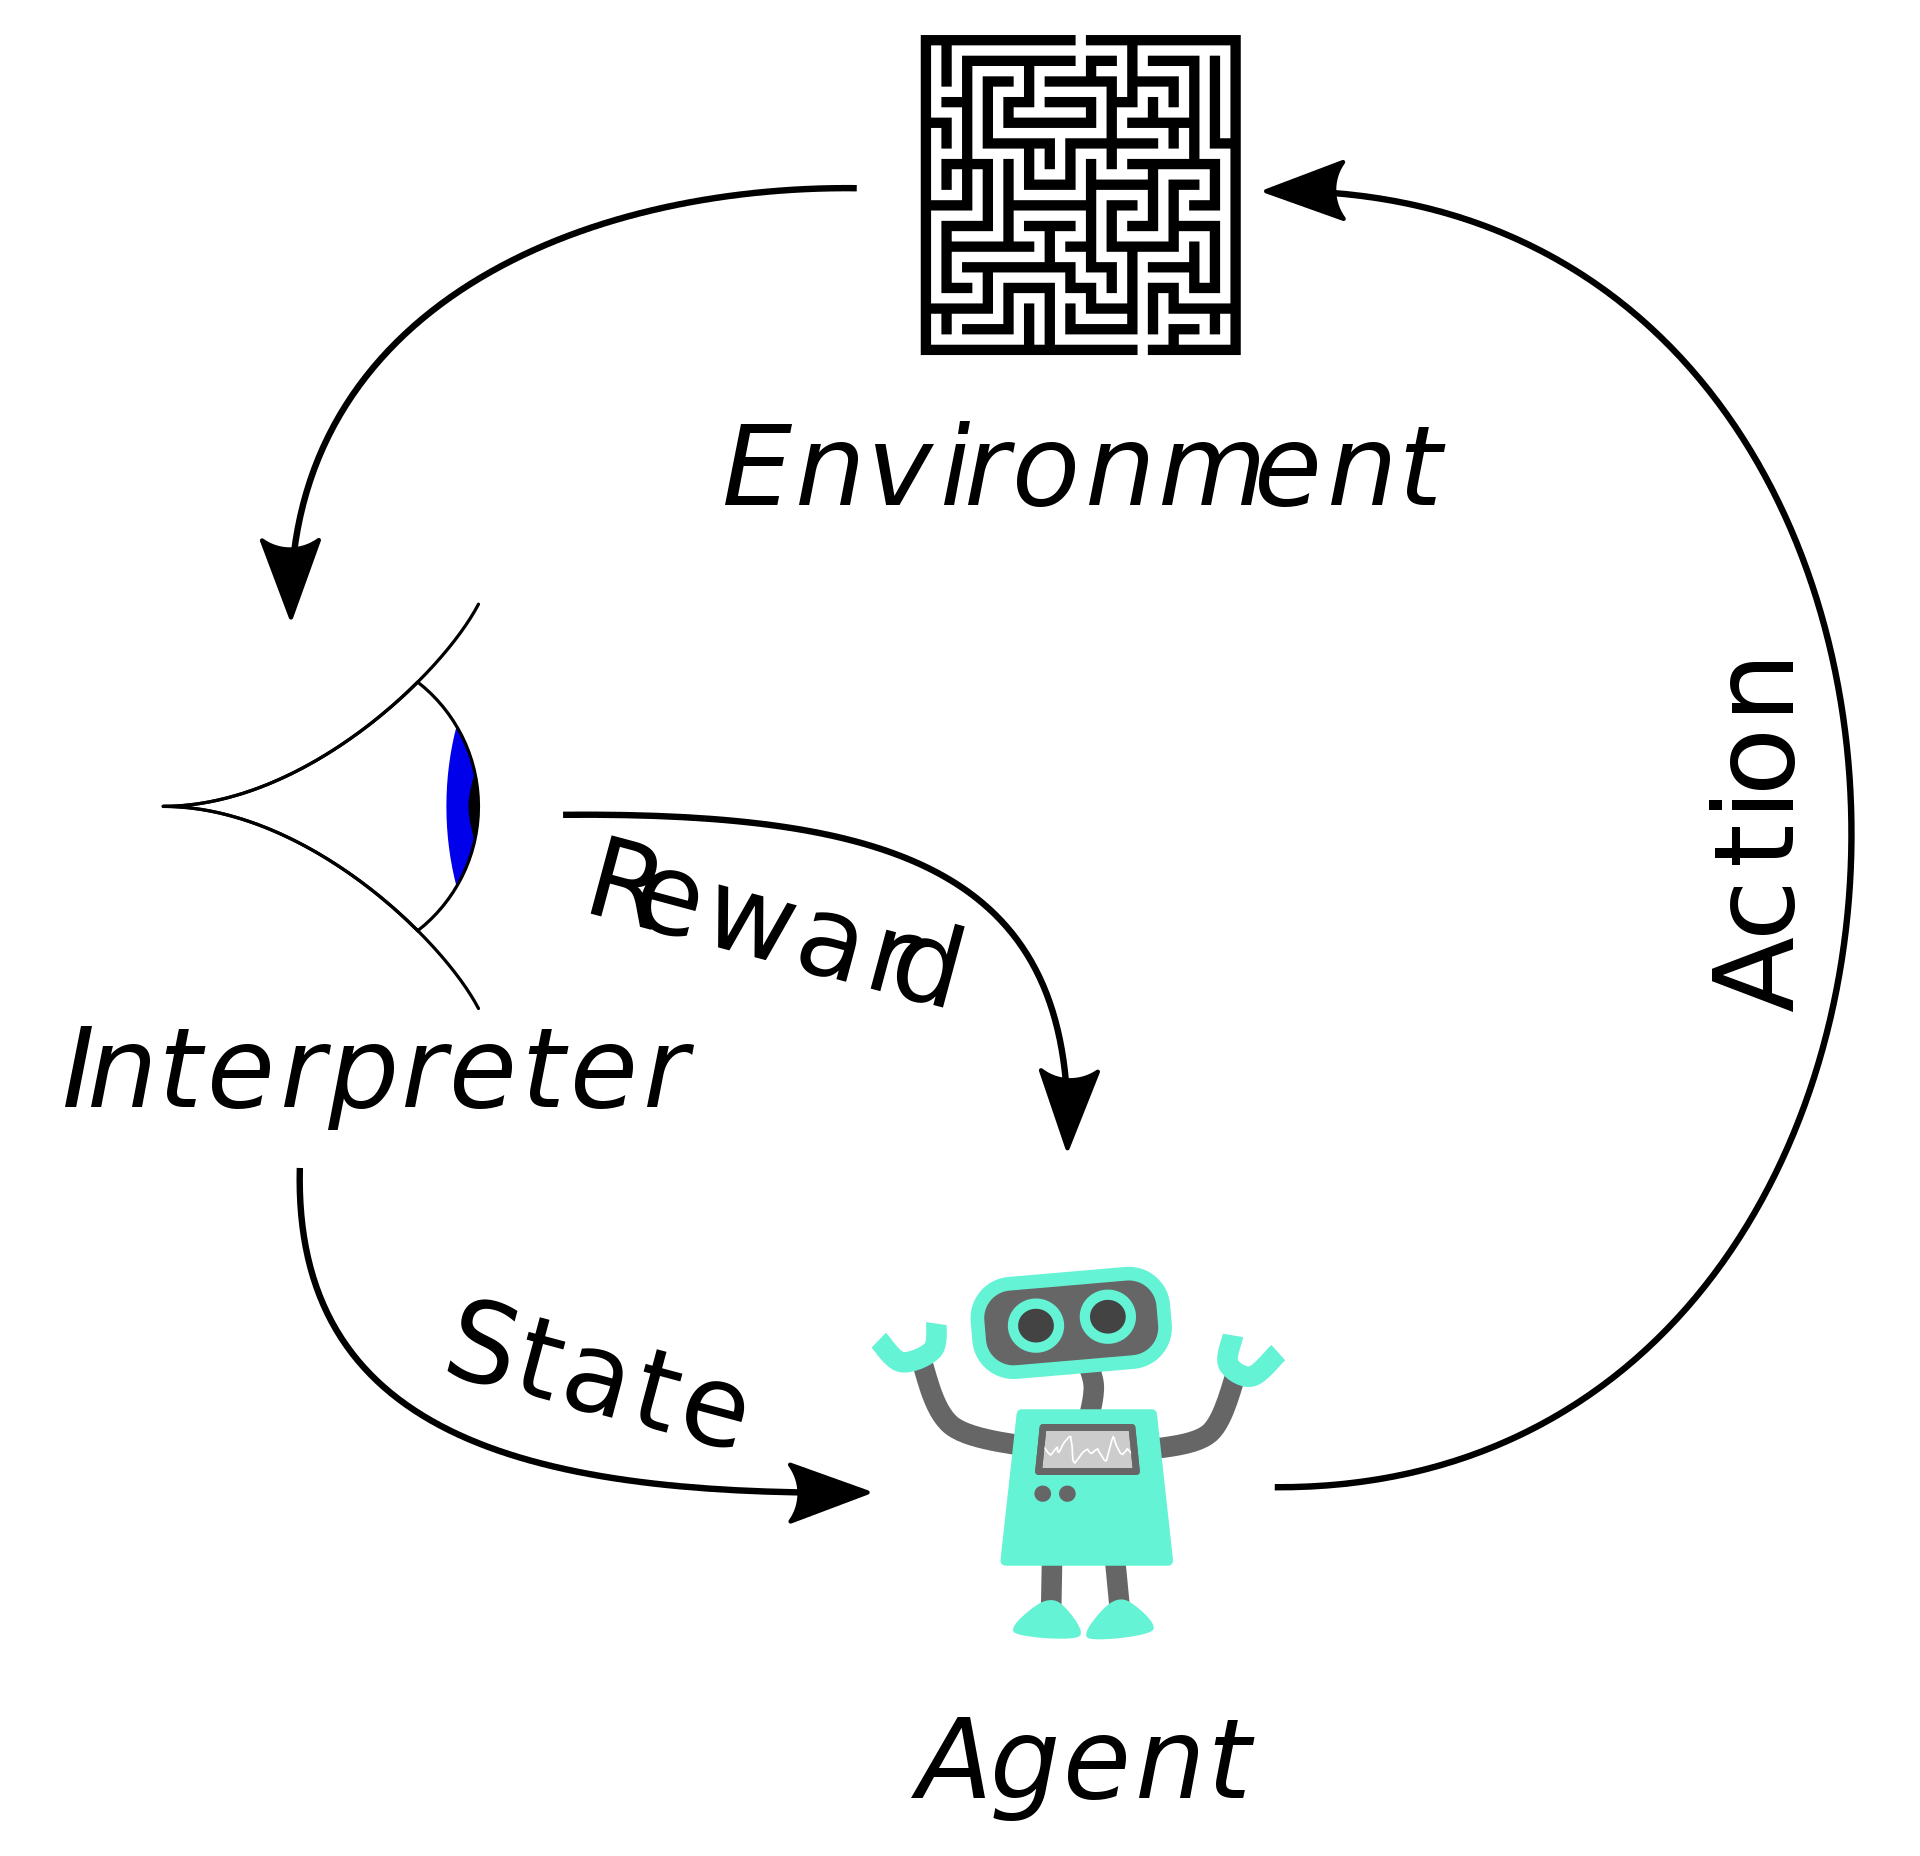
Welcome to the fifth episode of our series of Guided Labeling Blog Posts1 .In the last four episodes, we introduced Active Learning and a practical example with body mass index data, which shows how to perform active learning sampling via the technique “exploration vs exploitation”. This technique employs label density and model uncertainty to select which rows should be labeled first by the user of our active learning application deployed on KNIME WebPortal.

Guided Labeling Model Uncertainty

Limitations of Active Learning

Active learning is a powerful technique to train a supervised model when you have data for your model input, but no labels attached. Despite its effectiveness injecting human expertise during the training of your model, active learning can still be time expensive. 

The active learning iterative process reduces the time required to label samples in order to train a model, but still requires manual labeling. In fact active learning allows you to reduce the number of manually labeled samples necessary to train a model, but it still might be necessary to label thousands of samples. The more complex your classification task is, the more labels are needed to teach your model even via active learning. 

Imagine a use case where labeling samples in a random order would take you several months before achieving good model performance. In this case applying active learning would still require your expert to label a large amount of samples, maybe reducing the time it takes from months to weeks. So the question is: besides active learning, is there another technique to save even more time?

When few or no labels are available, there are a few additional techniques to active learning you can use to train a model (e.g. semi-supervised learning, transfer learning, etc). In this episode we will focus on a technique called weak supervision. While active learning focuses on training a model aiming at gathering a small sample of labels of high quality, weak supervision instead leverages on gathering an enormous sample of labels of doubted quality from several and totally different sources. Let’s see more in detail what this other technique is about. 

Learning from Weak Label Sources

While active learning was already well known way before the terms “data science” and “AI” were coined, weak supervision became popular in recent years when the Stanford AI Lab released a Python library called Snorkel in around 2019.

To understand how weak supervision works we'll use the following example. Imagine you want to decide whether or not to watch a list of movies based only on your friends suggestions and ignore any features of the movies. Your friends give their opinion based on whether they watched it or not and whether they liked it or not. If they did not watch the film they will simply not share any opinion, but if they have watched it they will give you a positive or negative opinion. 

To summarize: 

  • Each “friend” can output for each “movie”: 
    • “good movie” (👍), 
    • “not seen movie” ( - ), 
    • “bad movie” (👎).
  • Assumptions:
    • You never watched any of those movies.
    • You do not know which friend has a taste similar to yours.
    • You want to ignore any information about the movie
      (e.g. moviegenre, main actor, ...).
    • Your friends' opinions are independent from one another (they do not know each other).

Technically you could join together all your friends' opinions on a single movie and compute an outcome whether the movie is worth watching or not. You could for example use a simple majority vote (Fig. 1).

Blending Knowledge with Weak Supervision

Figure 1 : Weak Label Sources Example: each friend is asked an opinion on a movie and can answer: “good movie” (👍), “not seen movie” ( - ), “bad movie” (👎). The combined result could be already computed via a simple majority vote.

By collecting opinions on all the movies on your list (Fig. 2), getting out the majority vote and watching the movie, you might realize that one friend's opinion might be more reliable than other ones. Is there a way to detect those friends before even watching the movies and compare the majority vote with the future public opinion from, for example, the next Oscars Academy Awards? In other words, is there a way to measure the accuracy of your friends in recommending movies? Keeping in mind whose opinion is more reliable might be wiser rather than a simple majority vote; that means basically weighting the opinion of certain friends more than others.

Blending Knowledge with Weak Supervision

Figure 2 : Weak Label Sources MatrixExample: When collecting opinions on different movies from different friends you can build a matrix table where each column is related to a different friend and each row a different movie.

Weak supervision is able to estimate the accuracy of each of your friends’ opinions over all movies and output a probabilistic label for each of them. This probabilistic output is a probability distribution for the possible outcome - besides the “not seen movie” case. In our example it would be a probability vector (Y) for each movie your friends recommended: 

Y : [ Probability “good movie” (p👍),
Probability of “bad movie” (p👎) ]

p👍+ p👎 = 1

Such probabilistic output takes into account the accuracy of your friends’ opinion and it weights each of your friends accordingly. If each of your friends has the same accuracy the output would be again a simple majority vote.

How does weak supervision train such a model without knowing which movie is great or not? How does it find the accuracy for each friend? This point is actually the pivotal concept within the weak supervision approach.

Weak supervision is able to train a model called either the “label model” or “generative model” using a Bayesian approach (Fig. 3). It takes as input the opinions and, via a matrix completion algorithm, detects patterns of agreement and conflicts to correctly weight each “friend” based on the learned accuracy.

Blending Knowledge with Weak Supervision

Figure 3 : Training the Weak Label Model: By feeding the Weak Label Sources Matrix into the Label Model you are able to compute a Probabilistic Output which weights each source based on its estimated accuracy. The matrix-completion algorithm can do this by detecting the overall patterns of conflicts and matching between the different independent sources via a Bayesian approach.

Generalizing the Weak Label Sources with Features Data

Using this approach you have an automated prediction to know which movie is worth watching. By blending knowledge from all your friends' opinions in a more reliable way than a simple majority vote, you can decide based on the highest probability at the output (Fig. 4). Of course, the more opinions, the more reliable the label model will be. 

The label model however only works if you have opinions on a movie. If you had to use this model on a movie for which your friends did not share any opinion it simply would not work. Furthermore, we are not using a lot of other information we could have had about the movie (moviegenre, main actor, movie budget,...). 

Blending Knowledge with Weak Supervision

Figure 4 : Scoring with the Label Model works only if you have weak label sources available for that particular data point and it totally ignores any other associated feature data.

For predicting whether a movie is good or not when no opinion is available, we could use additional movie information and the output of the label model. This way we can generalize what the label models produced to new movies via a second model. All we need is a machine learning model able to learn a classification task from probabilistic labels instead of pure labels. It turns out that neural networks, logistic regression, and - with a few adaptations - many others are also suitable. This second model is known in weak supervision as the “discriminative model” (Fig. 5).

Blending Knowledge with Weak Supervision

Figure 5 : Training with the Discriminative Model requires the output of the Label Model and the associated feature data. Neural networks (deep learning) alongside many other ML algorithms can be trained via probabilistic labels instead of standard labels for learning a classification task.

Once you train a discriminative model you will be able to score a prediction on any movie for which you have available features (Fig. 6). The discriminative model is what you need to deploy, no need to carry the label model along.

Blending Knowledge with Weak Supervision

Figure 6 : Scoring with the Discriminative Model is possible via simply provided features of the new data point just like in the deployment of any machine learning model.

You might be thinking now, great so now I can blend my friends' opinions on movies with features about those movies in a single model, but how is this useful if I don't have any labels to train a generic supervised model? How can weak supervision become an alternative to active learning in a generic classification task? How can this analogy with many “friends” labeling “movies” work better than a single human expert like in active learning?

In the next Guided Labeling Blog Post episode, we will generalize the weak supervision approach to train any machine learning classifier on a generic unlabeled dataset and compare this strategy with active learning. Stay tuned!

And take part in discussions around the Guided Labeling topic on this KNIME Forum thread!

The Guided Labeling Blog Series

By Paolo Tamagnini (KNIME)


Integrated Deployment Blog Series - Episode 1: An Introduction to Integrated Deployment

$
0
0
Integrated Deployment Blog Series - Episode 1: An Introduction to Integrated DeploymentpaolotamagMon, 07/13/2020 - 13:30

Welcome to the Integrated Deployment Blog Series, a series of articles focusing on solving the challenges around productionizing data science.


An Introduction to Integrated Deployment

Figure 1: Creating and productionizing data science. 

Topics will include resolving the challenges of deploying models, building guided analytics applications that create not only a model but a complete model process, using KNIME’s component approach to AutoML to collaborate on projects, and finally setting up an infrastructure to not only monitor but automatically update production workflows. The key feature to solving many of these issues is Integrated Deployment and in this article, we explain that concept with practical examples.

Data Scientists, regardless of what package they use, are used to training machine learning models to solve business issues. The classic approaches to creating data science, such as CRISP-DM cycle, support this approach. But the reality is that a great model can never simply be put into production. A model needs the data prepared and surfaced to it in production in exactly the same way as when it was created. And there may be other aspects involved with the use of the model and the surfacing of results in the correct form that the model itself does not intrinsically have in it.

To date, that huge gap in the process of moving from creating a great model to using it in production has been left to the user, regardless of whether you are using KNIME or another package such as Python. Effectively you have always needed to manually design two workflows - one to train your model and another to deploy it. With KNIME Analytics Platform 4.2, the deployment workflow can now be created automatically thanks to a new KNIME Extension: KNIME Integrated Deployment. 

There is a small introductory blog explaining Integrated Deployment here. But in this article we’d like to dive in a bit deeper for KNIME fans. To do that, we will look at two existing workflow examples of model creation and model deployment. We will then redo them so that the first creation workflow automatically creates the production workflow.

These examples come from the Data Science learnathon workshop that we have been running for many years. As onsite and online events this workshop provides an overview of how to use KNIME Analytics Platform for not only creating great data science but productionizing it. We build two workflows. 

The first workflow is the modeling workflow, used to access the available data, blending them in a single table, cleaning and removing all missing values as well as any other inconsistencies, applying domain expertise by creating new features, training models, optimizing, and validating them. 

The second workflow is the deployment workflow which not only loads all the settings trained in the modeling workflow but builds the data preprocessing that the model expects. In many cases, the deployment workflow is not just a standalone KNIME workflow but is designed so that it can be called via REST API by an external application to create a super simple application to send new data as input and get back the model output via an http request.

In this example, we train a model to predict churn of existing customers given the stored data of previous customers. The modeling workflow accesses the data from a database and joins from an Excel file, the data is prepared by recomputing the domain of each column, converting a few columns from categorical to numerical and partitioning it in two sets, the training and the test set. A missing value imputation model is created based on the distribution of the training set, model optimization is performed to find the optimal parameters for random forest (e.g. number of trees) which is trained right after. The trained model is used to compute churn prediction on the test, which contains customers the model has never seen during training. Via an interactive view the threshold of the model is optimized and applied on the test set. The evaluation of the model is checked both with the former threshold and the new optimized one via confusion matrices. The missing value model and the random forest model are saved for the deployment workflow. The overall KNIME modeling workflow is shown in Figure 2.

An Introduction to Integrated Deployment

Figure 2 : The modeling workflow is created node by node by the user from data preparation all the way to model evaluation. 

To deploy this simple churn prediction model (before KNIME Analytics Platform 4.2) the data scientists had to manually create a new workflow (Figure 3) and node by node rebuild the sequence of steps including manually duplicating the preparation of the raw data so that the previously created and stored models can be used. This manual work requires the KNIME user to spend time to drag and drop again the same nodes that were already used in the modeling workflow. Additionally the user had to make sure the written model files could be found by the deployment workflow and that new data could come in and out of the deployment workflow via JSON format required by the REST API framework. In this special case where the binary classification threshold was optimized, the data scientists even had to even manually type in the new threshold value.

An Introduction to Integrated Deployment

Figure 3. The deployment workflow created by hand before the release of Integrated Deployment. workflow by hand.again many nodes already used in the modelling workflow.

Deployment using this manual setup was totally customary but time consuming. Whenever something had to be changed in the modelling workflow, the deployment workflow had to be updated manually.
Consider for example training another model that is not random forest or adding another step in the data preparation part. Retraining the same model and redeploying it was possible but automatically changing nodes it was not.

Integrated Deployment empowers you to flexibly deploy automatically from your modelling workflow.

How does the churn prediction modeling workflow look when integrated deployment is applied? 

In Figure 4 you can see the same workflow as in Figure 2 with the exception that a few new nodes are used. These are the Capture nodes from the KNIME Integrated Deployment Extension. The data scientist can design the deployment workflow as she builds the modeling workflow by capturing the segments to be deployed. In this simple example only two segments of workflows are captured to be deployed. The data preparation and the scoring framed in purple in Figure 4. Any node input connection which does not come from the Capture Workflow Start is fixed as a parameter in the Deployment Workflow. In this case the only dynamic input and output of the captured nodes is a data port specified in the Capture Workflow Start and End nodes. The two captured workflow segments are then combined via Workflow Combiner node and the Deployment Workflow is automatically written on KNIME Server or in the local repository via a Workflow Writer node.

An Introduction to Integrated Deployment

Figure 4: This time, the modeling workflow is created node by node by the data scientists from data preparation all the way to model deployment but includes the new KNIME Integrated Deployment Extension nodes. 

It is important to emphasize that the Workflow Writer node has created a completely configured and functional workflow.

In Figure 5 you can have a look at the automatically generated deployment workflow. All the connections that were not defined in the modeling workflow by the Capture Workflow Start and Capture Workflow End nodes are static and imported by the PortObject Reference Reader nodes. Those are generic reader nodes able to load the connection information of static parameters found during training. In Figure 5 the example deployment workflow is reading in three parameters: the missing value model, the random forest model and the double value to be used as binary classification threshold.

An Introduction to Integrated Deployment

Figure 5: The deployment workflow automatically generated by Integrated Deployment. 

In a scenario where data are prepared and models are trained and deployed in a routine fashion, integrated deployment becomes super useful for flexibly retraining and redeploying on the fly with updated settings. This can be fully automated by using the Deploy Workflow to Server node to pass the created workflows for deployment via KNIME Server. where it’s where the models are deployed to when using the KNIME Analytics Platform. You can see an example of the the new Deploy Workflow to Server node using a KNIME Server Connection in Figure 6.

In the animation the KNIME Executor is added, the Workflow Object is connected to its input and via the dialogue the right amount of input and output ports are created. This setup offers a model agnostic framework necessary for machine learning interpretability applications such as LIME, shapley values, SHAP, etc. 

Even if you do not have access to a KNIME Server, the Integrated Deployment Extension can be extremely useful when executing a piece of a workflow over and over again. Just imagine that you would like to test a workflow multiple times without having to copy the entire sequence of nodes on different branches. With the new Workflow Executor node you can reuse a captured workflow on the fly using the black box approach (Figure 6). This comes in extremely handy when working with the KNIME Machine Learning Interpretability Extension.

An Introduction to Integrated Deployment

Figure 6: A workflow captured with the Integrated Deployment Extension can be deployed on a KNIME Server dependence.

This introductory example is of course only a first demonstration of how Integrated Deployment enhances analytics workflows in KNIME. In the upcoming episodes we will see how this new extension empowers a KNIME expert to flexibility train, score, deploy, maintain and monitor machine learning models in an automated fashion. Stay tuned!

The Integrated Deployment Blog Series

Author: Paolo Tamagnini (KNIME)

Integrated Deployment Blog Series - Episode 2: Continuous Deployment

$
0
0
Integrated Deployment Blog Series - Episode 2: Continuous DeploymentpaolotamagMon, 07/13/2020 - 14:00

In this second episode of the Integrated Deployment Blog Series - a series of articles focusing on solving the challenges around productionizing data science - we look at the Model part of the process.

Integrated Deployment Blog Series - Continuous Deployment

In the previous episode we covered a simple integrated deployment use case. We first looked at an existing pair of workflows, one that created a model and the second that used that model for production. Then we looked at how to build a model workflow that automatically creates a workflow that can be used in production immediately. To do this, we used the new KNIME Integrated Deployment Extension. That first scenario was quite simple. Things can get quickly more complicated, however, in a real situation. 

For example how would the workflow using integrated deployment look if we were training more than one model? How would we flexibly deploy the best one? Assuming that we have to test the training and deployment workflow on a subset of the data. How would we then retrain and redeploy on a bigger dataset by picking only the interesting pieces of the initial workflow? Well with Integrated Deployment!

To be able to train multiple models, select the best one, retrain it again, and automatically deploy it we would want to make a hierarchy of workflows: the modeling workflow that generates the training workflow that generates the deployment workflow (Fig. 1). 

Integrated Deployment Series - Continuous Deployment

Figure 1: A diagram explaining the hierarchical structure of workflows necessary to build an application for selecting the best model and retraining and deploying it on the fly.

The entire system can be controlled and edited from the modeling workflow thanks to Integrated Deployment. By adding Capture Workflow nodes (Capture Workflow Start and Capture Workflow End) the data scientist is able to select which nodes to use to retrain the selected model and which nodes to deploy it. Furthermore using switches like Case Switch nodes and Empty Table Switch node the data scientist can define the logic on what node should be captured and added to the other two workflows.

Using the framework depicted in Figure 1 becomes especially useful in a business scenario where retraining and redeploying a variety of models takes place in a routine fashion. Without such a framework the data scientist would be required to manually intervene on the workflows each time the deployed model needs to be retrained with different settings.

In Figure 2 an animation shows the modeling workflow - with Integrated Deployment used to capture and execute on demand the training workflow and finally write only the deployment workflow

Integrated Deployment Series - Continuous Deployment

Figure 2: An animation scrolling the Modeling Workflow in all its length. 

The workflow goes through a standard series of steps to create multiple models, in this case a Random Forest and an XGBoost Model. It then offers an interactive view so that a data scientist can investigate the results and decide which model should be retrained on more data and finally deployed. It covers the steps of the CRISP-DM cycle and in addition offers interactive views to the user. The user can select which workflow should be retrained on more data and finally deployed. 

At this point you might feel a bit overwhelmed. It’s like that movie about dream with a dream from 2010, Inception. If that is the case do not worry it will get better.

We will walk through each part of the workflow and display them here in the blog. You might find it more helpful to have the example open in KNIME as you follow along. Remember to have KNIME 4.2 or later installed! The example workflow can be found here on the KNIME Hub.

We start by accessing some data as usual from a database and a CSV file and blend them. At this point the data scientist is looking at the data via an interactive composite view called Automated Visualization (Fig.3). This view offers the data scientist a quick way to look at anomalies via a number of charts which automatically display what is most interesting statistically.

Integrated Deployment Series - Continuous Deployment

Figure 3: The modeling workflow is used to access and blend the data, which is then interactively inspected via a data visualization dashboard.

Once that is done the data scientist builds the custom process to prepare the data for the analytics process. In this example we are just going to update the domain of all columns and convert a few columns from numerical to categorical. The data scientist captures the workflow with Integrated Deployment because it will be needed in the future where more data is to be processed. In our example, the data scientist then opens an Interactive Column Filter Component. This view allows for the quick removal columns which should not be used by the model for all the normal reasons such as too many missing, constant or unique values (Fig. 4).

Integrated Deployment Series - Continuous Deployment

Figure 4: The modeling workflow continues with the data preparation part which is captured for later deployment. Another interactive view is used to filter out irrelevant columns quickly before the training of the models. Also the interactive filter is captured for deployment purposes.

This data scientist in particular is dealing with an enormous amount of rows. To perform model optimization quickly he wants to subsample the data with a Row Sampling node to use only 10%. The data scientist knows she will need to retrain everything afterwards with more data to get accurate results but for the time being is happy with 10%. After splitting the sub-sampled data in train and test she trains an XGBoost Model and a Random Forest model with Parameter Optimization on top. To retrain later the data scientist also captures this part with Integrated Deployment. After training the two models she uses yet another interactive view to see which model is better (Fig. 5). The chosen model is Random Forest which is automatically selected as Workflow Object port by the Component.

Integrated Deployment Series - Continuous Deployment

Figure 5: The data scientist can use an interactive view using the Binary Classification Inspector node to browse the two models performance metrics and select one model to be retrained and deployed. The selected model is given out as Workflow Object at the output of the Component.

The selected model is retrained on the entire dataset (no 10% subsampling this time) with a Workflow Executor node using the output of the previous component. The previous component produces a training workflow (Fig. 6). When executing the training workflow, the output from its Workflow Executor node is the deployment workflow (Fig. 6). And there you have it: a complete and automated example of continuous deployment! Hopefully you don’t have that overwhelmed feeling anymore. 

Integrated Deployment Series - Continuous Deployment

Figure 6: The selected Random Forest model is being written and executed as a training workflow on the entire dataset. Only then is a new deployment workflow generated and passed on as a later step in the modeling workflow.

The deployment workflow and the scored new test set is used in the last interactive view (Fig. 7) to see the new performance, as this time more data was used. Two buttons are provided: the first one enables the download for the deployment workflow in .knwf format, the second one offers the ability to deploy it to KNIME Server and save a local copy of the produced deployment workflow.

Integrated Deployment Series - Continuous Deployment

Figure 7: The final interactive view of the modeling workflow used to inspect the performance on the entire dataset and decide whether to deploy or not the model. The workflow to be deployed can also be downloaded as a .knwf file.

This same workflow can be deployed to KNIME WebPortal via KNIME Server as an interactive Guided Analytics application. The application can be used by data scientists whenever they need to go through a continuous deployment cycle - which, in effect, is a tight, custom and interactive AutoML application. Of course this particular application is hard coded for this particular machine learning use case, but you can modify this example to suit your needs.

Stay tuned for the next episodes of the Integrated Deployment Blog Series where we show how to use Integrated Deployment for a more complete and flexible AutoML solution.

The Integrated Deployment Blog Series

Author: Paolo Tamagnini (KNIME)

Will They Blend? Theobald meets SAP HANA

$
0
0
Will They Blend? Theobald meets SAP HANAMaaritMon, 07/20/2020 - 13:30

In the "Will They Blend" series of articles we experiment with the most interesting blends of data and tools. Whether it's mixing traditional sources with modern data lakes, open source devops on the cloud with protected internal legacy tools, SQL with noSQL, web-wisdom-of-the-crowd with in-house handwritten notes, or IoT sensor data with idle chatting, we're curious to find out: will they blend?

In today’s challenge we’re going to blend data on a SAP system that is accessed in two ways.

Will They Blend Theobald meets SAP HANA
  1. The legacy way - via the JDBC driver of the database, SAP HANA for example, and 
  2. The new way - via the Theobald Xtract Universal Server

The legacy way requires a few steps: registering the JDBC driver of the SAP HANA database in KNIME, connecting to the database with the DB Connector node, selecting a table on the connected database, and reading it into KNIME. Using the SAP integration available from KNIME Analytics Platform version 4.2 forward, you can access and load SAP data into KNIME just by one node called SAP Reader (Theobald). 

In our example, we extract KPIs from orders data, and show their development over time. We access the data about the submitted orders the legacy way. The data about the features of the ordered items are available on the Theobald Xtract Universal Server, so we read this data with the SAP Reader (Theobald) node. We connect to both systems from within KNIME, join the data on the sales document key column available in both tables, and show the historical development of a few KPIs in an interactive dashboard: Is the number of orders increasing over time? What is the most popular product per year? Let’s take a look!

Will They Blend Theobald SAP HANA

Figure 1. Accessing SAP data via Theobald (new) and via the JDBC driver of the SAP HANA database (legacy) before blending and preprocessing the data, and calculating and visualizing KPIs in KNIME Analytics Platform. 

Challenge: Access SAP data via Theobald and via the JDBC driver of the SAP HANA database 

Topic: Calculate KPIs of orders/items data and visualize the historical development of the KPIs in an interactive dashboard

Access mode: Connect to Theobald Xtract Universal Server and to SAP HANA database

Integrated Tools: SAP, Theobald

Experiment

The workflow in Figure 2 shows the steps in accessing the SAP data via Theobald (top branch) and via the JDBC driver of the database (bottom branch). The data for this experiment is stored in the Sales Document: Item Data and Sales Document: Header Data tables included in SAP ERP. After accessing the data, we join the tables, and extract year and month from the timestamps in order to calculate the KPIs at a meaningful granularity. Next, we calculate four different KPIs: total number of orders per month, average number of orders per month, average net weight of an order in each month, and the most popular product in each year. The KPIs are shown in the interactive view of the KPI Dashboard component (Figure 3). You can download the workflow Will They Blend: SAP Theobald meets SAP HANA from the KNIME Hub.

Will They Blend - Theobald meets SAP HANA

Figure 2. A workflow to access SAP data via Theobald and via the JDBC driver of the SAP HANA database, and to blend and preprocess data before calculating and visualizing KPIs in an interactive dashboard. The Will They Blend: SAP Theobald meets SAP HANA workflow can be downloaded from the KNIME Hub.

Accessing Theobald Xtract Universal Server

We want to access the “Sales Document: Item Data” table that contains detailed information about item orders (each row contains details of a specific item of an order) and is accessible via the Theobald Xtract Universal Server. The server provides a so-called table extraction feature where we can extract specific tables/views from various SAP systems and store them as “table extraction” queries. The KNIME SAP Reader (Theobald) node is able to connect to the given Xtract Universal Server to execute those queries and import the resulting data into KNIME.

  1. Open the configuration dialog of the node, and enter the URL to the Theobald Xtract Universal Server. Click the Fetch queries button to fetch all available extraction queries on the server. We can then select one query from the drop-down list, in our case it is the “Sales Document: Item Data” table. Note that it is necessary to provide SAP credentials in the authentication section if the selected query is connected to a protected SAP system. 
  2. Executing the node will execute the selected query on the Xtract Universal server and imports the data into a KNIME table. 

Accessing SAP HANA

We want to access the “The Sales Document: Header Data” table that contains information about the submitted orders and is available on the SAP HANA database on a locally running server. We can access the database, like any other JDBC compliant database that doesn’t have a dedicated connector node, with the DB Connector node. In the configuration dialog of the DB Connector node, we can select the JDBC driver of an arbitrary database in the Driver Name field. In order to make our preferred database SAP HANA show in the Driver Name menu, we need to register its JDBC driver first.

  1. To register a JDBC driver in KNIME, go to File → Preferences → KNIME → Database. The driver (.jar file) is installed as part of the SAP HANA client installation. To find where the JDBC driver is located, please check the SAP HANA documentation. Then we can add it to KNIME by following the steps described here in the KNIME Database Extension Guide.
  2. After registering the JDBC driver, open again the configuration dialog of the DB Connector node, select the newly registered JDBC driver in the menu, for example, sap: [ID: sap_id], and specify the database URL, for example, jdbc:sap://localhost:39015. Also provide the credentials with one of the authentication methods.
  3. The connection to the SAP HANA database is now created. Continue with the DB Table Selector node to select a table on the database and the DB Reader node to read the data into a KNIME table.

Blending data and calculating the KPIs

After accessing the two tables, we join them on the sales document key (VBELN column), and get a table that contains information on both the submitted orders and the items included in each order. Since the current granularity of the data is daily, and the time range of the data reaches from January 1997 to May 2020, we aggregate the data at a monthly level before calculating the KPIs. 

Results

The interactive view output of the KPI Dashboard component (Figure 3) visualizes the KPIs. In the line plot in the top left corner we can see that the average number of orders per month was the highest at the beginning of 2000, and since 2014 it stagnates at a relatively low level. Yet in the past there were some quieter periods followed by periods with more orders, for example, the low around 2008 followed by a peak around 2013. We can find a similar kind of pattern in the line plot in the top right corner that shows in addition the total number of orders per month. 

In the tile view in the bottom left corner, we can browse through the most popular products for each year. And finally, in the line plot in the bottom right corner, we can see that the ordered items have become lighter over time, or the orders contain less items than before and have therefore less weight. An especially remarkable decrease in the average weight of an order happened around 2014. 

Will They Blend - Theobald meets SAP HANA

Figure 3. Interactive dashboard visualizing the KPIs that were calculated after accessing and blending the orders/items data available as SAP tables

Do they or don't they?

In the dashboard shown in Figure 3, the product names and weights come from the “Sales Document: Item Data” table, accessed via Theobald Xtract Universal Server, whereas the order counts come from the “Sales Document: Header Data” table, accessed via the JDBC driver of an SAP HANA database.

All this information can be visualized in one dashboard, so yes, they blend!

Authors: Maarit Widmann & Andisa Dewi (KNIME)

Guided Labeling Blog Series - Episode 6: Comparing Active Learning with Weak Supervision

$
0
0
Guided Labeling Blog Series - Episode 6: Comparing Active Learning with Weak SupervisionpaolotamagMon, 07/27/2020 - 10:00

Welcome to the sixth episode of our series of Guided Labeling Blog Posts1 by Paolo Tamagning and Adrian Nembach (KNIME).

In the last episode we made an analogy with a number of “friends” labeling “movies” with three different outcomes:“good movie” (👍), “not seen movie” ( - ), “bad movie” (👎). We have seen how we can train a machine learning model predicting also movies no friend has watched before and adding to the model additional feature data about such movies. Let’s pick up where we left off.

Guided Labeling Model Uncertainty

You can blend friends' movies opinions in a single model, but how is this useful if you don’t have any labels to train a generic supervised model? How can weak supervision become an alternative to active learning in a generic classification task? How can this analogy with many “friends” labeling “movies” work better than a single human expert like in active learning?

Weak Supervision instead of Active Learning

The key feature that differentiates active learning from weak supervision is the source of the labels we are using to train a generic classification model from an unlabeled dataset:

Unique vs Flexible

In active learning the source of labels - referred to in literature as the “oracle” - is usually quite unique, making it expensive and hard to find.This can be an expensive experiment but more often than not we are talking about a subject matter expert (SME), that is a human with domain expertise. In weak supervision the weak source can be a human with less expertise who makes mistakes, but also something else like an heuristic which applies only to a subset of the dataset.

IF “movie budget category” is “low”
AND “actor popularity” is “none” :
MOVIE LABEL = “👎”
ELSE :
MOVIE LABEL = “-”

Of course this rule (or heuristic) is not accurate at all and only applies to some movies, but this can be thought of as a weak source in weak supervision and considered a labeling function. In most cases you will need an expensive human expert to build those heuristics, but this is still less time consuming than manual, labeling work. Once you have a set of heuristics, you can apply them to millions of datapoints within a few seconds.

Solid vs Weak

While in active learning the label source theoretically always provides a 100% accurate label, in weak supervision we can have weak sources that cannot label all samples and can be less accurate.

Single vs Multiple

Active learning is usually described as a system counting on a single and expensive source of labels. Weak supervision counts on many not so accurate sources.

Human-in-the-Loop vs Prior Model Training

In active learning the labels are provided as the model improves within the human-in-the-loop process. In comparison, in weak supervision the noisy labels are provided from all weak sources before the model is trained.

From Movie Opinions to Any Classification Task

Our example about blending movie opinions from people was helpful to explain the weak supervision framework on an intuitive example. However for movie recommendation use cases there are better algorithms than weak supervision (e.g. collaborative filtering). Weak supervision is powerful because it can been used anywhere where:

  • There is a classification task to be solved
  • You want to use supervised machine learning
  • The dataset to train your model is unlabeled
  • You can use weak label sources

Those requirements are quite flexible making weak supervision versatile for a number of use cases where active learning would have been far more time consuming in terms of manual labeling.

Your unlabeled dataset of documents, images, or customer data can have weak label sources just like you had “opinions from friends” on “movies”. These “friends” can be considered labeling functions which can label only a subset of your rows (in the example that would be only those “movies” they have watched) with accuracy better than random. The “opinions” we had (“👍” or “👎”) are the output labels of the labeling functions.

We can then extend this solution to any machine learning classification problem with missing labels. Those output labels can be only two for binary classification, like in our example, or even more for the multi-class problem. If a labeling function is not able to label a sample it can output a missing value (“-”).

While in active learning the expensive expert was providing labels row by row, in weak supervision we can simply ask the expert to provide a number of labeling functions. By labeling function we mean any heuristic that, in the expert opinion, can label correctly a subset of labels. The expert should provide as many labeling functions as possible that cover as many rows as possible, and that have an accuracy as high as possible (Fig. 1).

Guided Labeling Comparing Weak Supervision with Active Learning

Figure 1 : A possible weak supervision framework: A Domain Expert provides Labeling Functions to the system. The produced weak label sources are fed to the Label Model which outputs the Probabilistic Labels to train the final Discriminative Model.

Labeling functions are only one example of weak label sources though. You can, for example, use predictions of an old model, which was only working for old data points in the training set; you can blend with a public dataset or with information crawled from the internet; ask cheaper non-experts to label your data and treat them as weak label sources. Any strategy that can label a subset of your rows with accuracy better than random labeling can be added to your weak supervision input. The theory behind the Label Model (Fig. 1) algorithm requires all label sources to be independent, however recent research shows that this requirement holds even with a high variety of weak label sources.

When dealing with tons of data and no labels at all, weak supervision's flexibility in blending knowledge from generic different sources can be a solution in training an accurate model without asking any expensive expert to label thousands of samples.

In the next Guided Labeling Blog Post episode we will look at how to train a document classifier in this way, using movie reviews: one more movie example via interactive views!

Stay tuned! And join us on the KNIME Forum to take part in discussions around the Guided Labeling topic on this KNIME Forum thread!

The Guided Labeling Blog Series

By Paolo Tamagnini (KNIME)


Metanode or Component - What's the Difference?

$
0
0
Metanode or Component - What's the Difference?rsMon, 08/03/2020 - 10:00

The goal of this article, by Rosaria Silipo (KNIME), is to help clarify the difference between metanodes and components. What's a metanode? What's a component? And when do you use what?

Metanode or Component - What's the Difference?

The common goal: make order in a messy workflow

Both metanodes and components are useful to clean up messy workflows. You can identify isolated blocks of logical operations in your workflows and include them inside either a metanode or a component. Your workflow will appear neat and tidy with less nodes than the original workflow.

And that is where the metanode goal in life ends.

Metanode or Component - What is the Difference?

Figure 1. Two visual configurations of the same example workflow. The usage of metanode and components (right) makes the view neat and clear.

What can a component do that a metanode cannot?

Let’s see now what a component can do additionally in comparison with a metanode.

A component can encapsulate flow variables

"What happens in the component stays in the component." This sentence describes the vacuum character of a component. Flow variables created within the component will not leave the component unless this is expressly set in the “Component Output” node. Note that flow variables created in the workflow but outside of the component will not enter the component, unless expressly set to do so in the “Component Input” node.

Metanode or Component - What is the Difference?

Figure 2. Sub-workflow view inside a component (Ctrl+double click the component to open this view).

In a metanode, all flow variables come in from the parent workflow and all flow variables created within the component go out into the workflow. No barriers, no limits. The risk is to otherwise generate an overpopulation of flow variables. 

A component can have a configuration window

Components can have a configuration window, metanodes cannot. 

Inserting one or more nodes from the folder “Workflow Abstraction/Configuration” provides one or more items for the configuration window of the component. The settings in the configuration window for these nodes are passed into the configuration window of the component. You can give a component a more or less complex configuration window, by inserting more or less of the configuration-type nodes.

Note. This is a way to create a new node without coding! All of the node templates in “EXAMPLES/00_Components” in the KNIME Explorer panel (or here on the KNIME Hub) are actually components that have a configuration window.

Metanode or Component - What is the Difference?

Figure 3. Configuration nodes inside a component (left). The configuration window of the component will let the user select the desired options (right).

A component can be given a view

Components can get a view, metanodes cannot. 

Inserting one or more nodes from the folder “Workflow Abstraction/Widgets” means that you have one or more items for your component views. The interactive view of these nodes is passed into the interactive view of the component. Views with many items from many corresponding widget nodes are called composite views.

Metanode or Component - What is the Difference?

Figure 4. Widget nodes inside a component (left). Each widget node is shown in the interactive view of the component (right).

In addition, Widget node views inside the same component subscribe to the selection and visualization of the same data. This means that what is selected in the view of a plot, for example, is also selected (and can be visualized exclusively) in the view of another plot within the same view of the same component.

Metanode or Component - What is the Difference?

Figure 5. Component interactive view. Each visualization subscribes to the selection of the other plots, changing appearance accordingly.

You can give a component a more or less complex composite view, by inserting more or less complex, interactive, connected Widget-type nodes.

How to make the choice

At this point the choice is easy. Try asking yourself these questions:

  • Do you need a new node with configuration settings? -> a component
  • Do you need a node producing a composite view? -> a component
  • Do you have a huge workflow and you would like to remove some of the flow variables going around in the workflow? -> a component
  • Do you just need to make space in an overcrowded workflow? -> a metanode

Refer to this table summary showing what a metanode can do and what a component can do.

Metanode or Component - What is the Difference?

Resources


Guided Labeling Blog Series - Episode 7: Weak Supervision Deployed via Guided Analytics

$
0
0
Guided Labeling Blog Series - Episode 7: Weak Supervision Deployed via Guided AnalyticspaolotamagMon, 08/10/2020 - 10:00

Welcome to the seventh episode of our series of Guided Labeling Blog Posts1by Paolo Tamagnini and Adrian Nembach (KNIME). In the previous episodes we have covered active learning and weak supervision theory. Today, we would like to present a practical example based on a KNIME Workflow and implementing Weak Supervision via Guided Analytics.

Guided Labeling Model Uncertainty

A Document Classification Problem

Let’s assume you want to train a document classifier, a supervised machine learning model that will predict precise categories for each of your unlabeled documents. This model is required for example when dealing with large collections of unlabeled medical records, legal documents or spam emails, defining a recurrent problem across several industries.

In our example we will:

  • Build an application able to digest any kind of documents
  • Transform the documents into bags of words
  • Train a weak supervision model using a labeling function provided by the user

We would not need weak supervision if we had labels for each document in our training set, but as our document corpus is unlabeled, we will use weak supervision and create a web based application to ask the document expert to provide heuristics (labeling functions).

Weak Supervision Deployed via Guided Analytics

Figure 1 : The weak supervision framework to train a document classifier: A document expert provides labeling functions for documents to the system. The produced weak label sources are fed to the label model which outputs the probabilistic labels to train the final discriminative model which will be deployed as the final document classifier.

Labeling Function in Document Classification

What kind of labeling function should we use for this weak supervision problem?

Well, we need a heuristic, a rule, which looks for something in the text of a document and, based on that, applies the label to the document. If the rule does not find any matching text, it can leave the label missing.

As a quick example let’s imagine we want to perform sentiment analysis on movie reviews, and label each review as either “positive (P)” or “negative (N)”. Each movie review is subsequently a document, and we need to build a somewhat accurate labeling function to label certain documents as “positive (P)”. A practical example is pictured in Figure 2.

Weak Supervision Deployed via Guided Analytics

Figure 2: An example of labeling function. In the first document, which describes a movie review, the labeling function is applied and provides a positive label; a slightly different document that does not apply to the rule means that the document is left unlabeled.

By providing many labeling functions like the one in Figure 2, it is possible to train a weak supervision model that is able to detect sentiment in movie reviews. The input of the label model (Figure 1) would be similar to the table shown in Figure 3. As you can see no feature data is attached to such a table, only the output of several labeling functions on all available training data.

Weak Supervision Deployed via Guided Analytics

Figure 3: The Output Labels of Labeling Functions for Sentiment Analysis. In this table the output of eight labeling functions is displayed for hundreds of movie reviews. Each labeling function is a column and each movie review is a row. The labeling function leaves a missing label when it does not apply to the movie review. If it does apply, it outputs either a positive or negative sentiment label. In weak supervision this kind of table is called a Weak Label Sources Matrix and can be used to train a machine learning model.

Once the labeling functions are provided it only takes a few moments to apply them to thousands of documents and feed them to the label model (Figure 4).

Weak Supervision Deployed via Guided Analytics

Figure 4: The Labeling Function Output in the Weak Supervision Framework. We feed the labeling functions to the label model. The label model produces probabilistic labels which alongside the bag of words data can be used to train the final document classifier.

Guided Analytics with Weak Supervision on the KNIME WebPortal

In order to enable the document expert to create a weak supervision model we can use Guided Analytics. Using a web based application that offers a sequence of interactive views, the user can:

  • Upload the documents
  • Define the possible labels the final document classifier needs to make a prediction
  • Input the labeling functions
  • Train the label model
  • Train the discriminative model
  • Assess the performance

We created a blueprint for this kind of application in a sequence of three interactive views, as shown in Figure 5. The generated web based application can be accessed via any web browser in the KNIME WebPortal.

Weak Supervision Deployed via Guided Analytics

Figure 5: The three views generated by our Guided Analytics Application blueprint. The application aims at enabling document experts to create a weak supervision model by providing labeling functions via interactive views.


The implementation of this application was possible in the form of KNIME workflow (Fig. 6) currently available on the KNIME Hub. The workflow is using the KNIME Weak Supervision extension to train the Label model with a Weak Label Model Learner node and Gradient Boosted Trees Learner node to train the Discriminative Model. Besides the Gradient Boosted Tree algorithm others are also available which can be used in conjunction with the Weak Label Model nodes (Fig. 6).

Weak Supervision Deployed via Guided Analytics

Figure 6: The workflow behind the Guided Analytics Application and the nodes available in KNIME Analytics Platform to perform Weak Supervision. The workflow compares the performance of the label model probabilistic output with the performance of the final discriminative model via an interactive view. The available nodes are listed in the lower part of the screenshot:. The nodes framed in yellow train a label model, and the nodes framed in green train a discriminative model. The workflow in this example uses Gradient Boosted Trees.

When Does Weak Supervision Work?

In this episode of our Guided Labeling Blog Series we have shown how to use weak supervision for document classification. We have described a single use case here, but the same approach can be applied to images, tabular data, multiclass classification, and many others scenarios. As long as your domain expert can provide the labeling functions, KNIME Analytics Platform can provide a workflow to be deployed on KNIME Server and made it accessible via the KNIME WebPortal.

What are the requirements for the labeling functions/sources in order to train a good weak supervision model?

  • Moderate number of label sources: The label sources need to be sufficient in number - in certain use cases up to 100.
  • Label sources are uncorrelated: Currently, the KNIME implementation of the label model does not take into account strong correlations. So it is best if your domain expert does not provide labeling functions that depend on one another. 
  • Sources overlap:The labeling functions/sources need to overlap in order for the algorithm to detect patterns of agreement and conflicts. If the labeling sources provide labels for a set of samples that do not intersect, the weak supervision approach is not going to be able to estimate which source should be trusted.
  • Sources are not too sparse: If all labeling functions label only a small percentage of the total number of samples this will affect the model performance.
  • Sources are better than random guessing: This is an easy requirement to satisfy. It should be possible to create labeling functions simply by laying down the logic used by manual labeling work as rules.
  • No adversarial sources allowed: Weak supervision is considerably more flexible than other machine learning strategies when dealing with noisy labels, i.e. weak label sources are simply better than random guessing. Despite this, weak supervision is not flexible enough to deal with weak sources that are always wrong. This might happen when one of the labeling functions is faulty and subsequently worse than simply random guessing. When collecting weak label sources it is more important to focus on spotting those “bad apples” rather than spending time in decreasing the overall noise in the Weak Label Sources Matrix. 

Looking ahead

In the upcoming final episode of Guided Labeling Blog Series we will look at how to combine Active Learning and Weak Supervision in a single, interactive Guided Analytics application.

Stay tuned! And join us on the KNIME Forum to take part in discussions around the Guided Labeling topic on this KNIME Forum thread!

The Guided Labeling KNIME Blog Series

Read the entire series on Guided Labeling by Paolo Tamagnini and Adrian Nembach (KNIME) here.


Will They Blend? Google BigQuery meets Databricks

$
0
0
Will They Blend? Google BigQuery meets Databricksemilio_sMon, 08/17/2020 - 10:00
Google BigQuery meets Databricks

Today: Google BigQuery public data meets Databricks. Shall I rent a bike in this weather?

The Challenge

“Life is like riding a bicycle. To keep your balance you must keep moving.” Despite its misuse under tons of Instagram pictures, this beautiful quote from Albert Einstein is still relevant today. In addition to physical activity, sustainable and shared mobility have become our weapon against daily traffic and pollution: terms like shared transport, bike sharing, car sharing are now part of our language, and more people than ever use these services on a daily basis. How often are these services used? How is their usage affected by other factors, such as the quality of the service or the weather conditions?

To answer these questions we need to collect data from a wide range of - typically disjointed - data sources, we also need a bit of imagination...and some patience! As an example, today we will mix together bike sharing data provided by Google BigQuery with weather data stored on Databricks, in order to see if and how weather conditions affect how the bikes are used.

For those who don’t know these two platforms, BigQuery is the Google response to the Big Data challenge. It is part of the Google Cloud Console and offers the ability to store and query large datasets using SQL-like syntax. Databricks is a cloud-based big data tool. Developed by the Apache Spark group, it offers a wide variety of operations - such as building data pipelines and scaling data science to production - tuning the functionalities offered by the Spark open source software.

Both these platforms are supported by KNIME Analytics platform, from version 4.1 upwards. You can download and install the KNIME BigQuery and the KNIME Databricks Integration from the KNIME Hub.

Topic. Multivariate visualization of bike-sharing data vs. weather data

Challenge. Investigate how weather influences usage of bike sharing

Access mode. KNIME Google BigQuery Integration and KNIME Databricks Integration

The Experiment

The first dataset, hosted on Google Big Query public data, is the Austin Bike Share Trips. It contains more than 600k bike trips during 2013-2019. For every ride it reports the timestamp, the duration, the station of departure and arrival, plus information about the subscriber. The second, smaller, dataset is the Austin Weather dataset, which is hosted on a Databricks platform. It contains daily weather information for the city of Austin, such as temperature, dew point, humidity, wind, precipitation, as well as adverse weather events.

Google BigQuery

In the upper part of our KNIME workflow (which you can download from the KNIME Hub here) we access the Austin Bike Share Trips dataset hosted on the Google BigQuery platform as a public dataset. In order to execute this part of the workflow you need:

Authentication

With the project credentials we are going to configure the Google Authentication (API Key)node. You will be required to provide your service account email and the P12 authentication file. You can find both of these in your Google Cloud Platform Project (once it has been activated) under: APIs & Services -> Credentials. 

Google BigQuery meets Databricks


If you are starting from scratch with Google Cloud Platform, I recommend this step-by-step guide which also shows you how to create a new project, generate new credentials, and install the driver on KNIME Analytics Platform.

Connecting to Google BigQuery

After authentication, the Google BigQuery Connector node provides access to the BigQuery platform.

Google BigQuery meets Databricks

 It uses the BigQuery JDBC Driver, the hostname (which is bigquery.cloud.google.com), and the Database name, which, in this case, is your Project ID. You can find the Project ID on your project’s dashboard on Google Cloud Platform (Figure 1). 

Google BigQuery meets Databricks

Figure 1. You can find your Project ID in the Google Cloud Platform. Add this ID in the “Database name” field in the configuration window of the Google BigQuery Connector node 

Query

At this point, Google BigQuery has become your remote database and you can use all the DB nodes provided by KNIME Analytics Platform in the DB -> Query folder in the Node Repository panel. DB Query nodes are useful to build and execute powerful queries on the data before they are imported into your workflow. This is particularly useful when, as in this case, we are only interested in downloading a portion of the data and not the entire - huge - dataset. 

Google BigQuery meets Databricks

Figure 2. The section of the KNIME workflow that performs custom queries on big data

Let’s add a DB Table Selector node, and open the configuration window to write a custom query like the one in Figure 3. It will extract features such as year, month and year fields, which we are using further on in the workflow. 

When typing SQL statements directly, make sure to use the specific quotation marks (``) required by BigQuery.

We can refine our SQL statement by using a few additional GUI-driven DB nodes. In particular, we added a DB Row Filter to extract only the days in [2013, 2017] year range and a DB GroupBy node to produce the trip count for each day.

Tip: If you feel nostalgic about SQL queries, you can open the result window of every DB node (right click on the node -> last entry) and navigate to the “DB Query” tab to check how the SQL statement looks like so far.

Finally, we append the DB Reader node to import the data locally into the KNIME workflow.

Google BigQuery meets Databricks

Figure 3. DB Table Selector node configuration window with a custom query

Databricks

The bottom part of the workflow handles the data stored on Databricks. What you need in this section is:

Please note that despite the fact that Databricks is a paid service, this part of the experiment is implemented using the Databricks Community Edition, which is free and offers all the functionalities we need for our challenge.

Note: KNIME Analytics Platform provides an open source Apache Hive driver that you can also use to connect to Databricks. However, we recommend using the official JDBC driver provided by Databricks.

Connecting to DataBricks 

First of all, let’s connect to Databricks adding the Create Databricks Environment node to the workflow. In the configuration window we are asked to provide a number of parameters:

  1. Databricks URL
  2. Cluster ID 
  3. Workspace ID
  4. Authentication

If you don’t already have this information, go to the Databricks webpage of your project and select the Cluster tab from the menu on the left. Next, select the cluster you want to connect to. At this point, the webpage URL will look like the one in Figure 4.

Google BigQuery meets Databricks

Figure 4. Databricks URL page in the form /?o=#/setting/clusters//configuration

Copy and paste these settings into the configuration window of the Create Databricks Environment node. 

Google BigQuery meets Databricks


If you are using Databricks on AWS, the URL will not display the workspace ID and you can leave this field blank. If you are not running the Community Edition, you can choose to use the Token authentication method. Otherwise you need to provide the credentials.

Note: The Databricks Community Edition automatically terminates a cluster after 2 hours of inactivity. If you want to re-run this example in a later moment, you should create a new cluster and update the Cluster ID in the configuration window of the Create Databricks Environment node.

Google BigQuery meets Databricks

Figure 5. The configuration window of the Create Databricks Environment node 

Executing this node, connects KNIME Analytics Platform to the Databricks cluster where the data are stored. The node has three ports, each of them providing a different access to the data:

  • Red port: the JDBC connection to connect to KNIME database nodes.
  • Blue port: the DBFS connection to connect to the remote file handling nodes as well as the Spark nodes.
  • Gray port: Spark context to connect to all Spark nodes. Please check in the Advanced tab of the configuration window that the option “Create Spark context” is enabled in order to activate this port.

In this example we are going to use some basic Spark operations to retrieve the data. Please refer to the KNIME on DataBricks guide, to explore further Databricks operations in KNIME Analytics Platform, plus more detailed instructions on how to configure Databricks for the first time.

Query

Google BigQuery meets Databricks

Figure 6. Section of the KNIME workflow for manipulating and importing data from Databricks using Spark nodes

Since we have stored the Austin Weather dataset on the Databricks cluster as a CSV file, let’s add a CSV to Spark node to access it. Double click the node to open the configuration window. Click “Browse” and select the austin_weather.csv from the cluster.

At this point we are ready to use some of the functionalities offered by the Spark nodes. You can find them all in the Node Repository panel under Tools & Services -> Apache Spark, after installing the KNIME Extension for Apache Spark.

Here, we want to extract information regarding the date field. We are going to split the date string into three separate columns: year, month and day. To do so we use the PySpark Script (1 to 1) node and write our simple script directly into the configuration window. After execution, the output port contains the processed Spark data. Finally, a Spark to Table node imports the results into our KNIME workflow. 

The Results

In these last steps we have extracted and prepared the data to be blended together. 

Let’s add a Joiner node, select the previously extracted year, month and day fields as the joining columns and let KNIME Analytics Platform do its tricks. After execution, right-click the Joiner node, select Joined table from the menu and have a look at the data, which are now blended. 

Following the Joiner node in the workflow, the Visualization component builds a dashboard, which includes different charts, such as bar chart, histogram, sunburst chart and the table view and the scatter plot shown in Figure 7. Each dot in the Scatter plot encodes the data of one day. The color of the dot tells us about the average daily temperature: the colder days are blue, while the hotter are red. 

Google BigQuery meets Databricks

Figure 7. Scatter plot of the blended data. Each dot encodes the number of bike rides for a specific day. It is colored according to the average daily temperature, blue for lower and red for higher values. We can explore different feature combinations directly from the Scatter plot interactive view.

The dashboard also offers some level of interactivity to dig into the exploration, such as an interactive slider to remove days according to the temperature level or a table showing only selected dots from the Scatter plot. As shown in Figure 7, we can also change the configuration of the chart directly from the dashboard, choosing different feature combinations by clicking the icon in the upper right corner. For example, we can get information about the relation between bike rides and rain level, choosing the corresponding features - PrecipitationSumInches for the X axis and NumberOfTrips for the Y axis. From the resulting scatter plot we can see that during the days with higher ride numbers there was hardly any rain or no rain at all: the bad weather conditions might have led people to choose different means of transportation. 

Let’s now click again on the icon and select the Date column for the X axis. The scatter plot updates revealing a seasonal trend of the bike rides. We can explore the details of the data points with the higher number of bike rides by selecting them from the scatter plot and then inspecting them in the Table view. It seems as if the peaks we can see mostly take place during March and October - when biking is probably more pleasant than under the rain or with very high or low temperatures.

At this point, we might want to upload the blended data back to the platforms, for future uses. In order to do so, let’s add a DB Table Creator to the workflow. We can connect it either to the Google BigQuery Connector or to the DB connection (Red port) of the Create Databricks Environment node. 

Note that additional steps such as the creation of a new schema in your personal BigQuery project might be necessary. 

Configure the DB Table Creator node by selecting the desired schema and giving a name to the table. Next, append and configure a DB Loader node to upload the data to the new remote table. 

Note: When using BigQuery remember to delete all the space characters from the column names. They would be automatically renamed during table creation and this will create conflict for the next step, since column names will no longer match.

Google BigQuery meets Databricks

Figure 8. DB Table Creator configured to create a new table named austin_bike in the default schema in Databricks

Wrapping up

In this example we have learned how to access and blend two popular cloud services - Google BigQuery and Databricks - using the extensions available in KNIME Analytics Platform. Together with these datasets, we have explored Austin bikesharing and how its usage is intrinsically related to weather conditions. 

The full workflow for this experiment is shown in figure 9 and is available for download from the KNIME Hub under Google BigQuery meets Databricks.

Google BigQuery meets Databricks

Figure 9. Final workflow blending data from BigQuery and Databricks. It can be downloaded from the KNIME Hub here.

Author: Emilio Silvestri (KNIME)

Further Resources

The Will They Blend KNIME Blog Series

In this blog series we experiment with the most interesting blends of data and tools. Whether it’s mixing traditional sources with modern data lakes, open-source devops on the cloud with protected internal legacy tools, SQL with noSQL, web-wisdom-of-the-crowd with in-house handwritten notes, or IoT sensor data with idle chatting, we’re curious to find out: will they blend? Want to find out what happens when IBM Watson meets Google News, Hadoop Hive meets Excel, R meets Python, or MS Word meets MongoDB?

If you enjoyed today's article, please share it generously and let us know your ideas for future blends.


Guided Labeling Blog Series - Episode 8: Combining Active Learning with Weak Supervision

$
0
0
Guided Labeling Blog Series - Episode 8: Combining Active Learning with Weak SupervisionpaolotamagMon, 08/24/2020 - 10:00

Welcome to the final episode of our series of articles about Guided Labeling! Today: can active learning and weak supervision be combined?

Guided Labeling Model Uncertainty

During this series we have discussed and compared different labeling techniques - active learning and weak supervision. We have also examined various sampling strategies, for example via exploration/exploitation approaches and random strategies. 

The question we wanted to answer was: Which technique should we use - active learning or weak supervision - to train a supervised machine learning model from unlabeled data?

The answer to this question definitely depends on the availability of domain experts and weak label sources. The harder it is to learn a decent decision boundary for your classification problem the more labels you're likely to need - particularly when your model is also complex (e.g. deep learning). This makes manual labeling less and less feasible, even when using the active learning technique. So unless you have years of patience and a large budget, weak supervision could be the only way.

But setting up labeling functions or weak label sources can also be quite tricky, especially if your data does not offer an easy way to quickly label large subsets of samples with simple rules.

In most cases it makes sense to keep the domain expert in control after the labeling functions have been provided. After training, the issues can subsequently be located, the labeling function improved, and the weak supervision model retrained in an iterative process. 

Checking feasibility before applying active learning or weak supervision is great, but why do we need to select one over the other?

Why not use both techniques?

Guided Labeling: Mixing and Matching the Two Techniques

Active learning and weak supervision are not mutually exclusive. Active learning is all about the human-in-the-Loop approach and the sampling inside of it that is needed to select more training rows. Weak supervision, on the other hand, is a linear model training process, requiring multiple inputs of somewhat flexible quality. There is actually a number of ways to combine the two techniques together efficiently. Ultimately, all these different ways of mixing and matching the two results can be implemented in Guided Analytics applications and made available to the domain experts via a simple web browser. For this reason we called the overall approach Guided Labeling.

We will explore two Guided Labeling examples (Fig. 1) which cover the most obvious scenarios where active learning and weak supervision can be combined.

  • The first example: Crowd-Sourcing Guided Labeling
  • The second example: “Human-in-the-Loop Guided Labeling”.
Guided Labeling - Episode 8 - Combining Active Learning with Weak Supervision

Figure 1: In the figure we summarize the Guided Labelingapproach examples that are generated when combining Active Learning with Weak Supervision: “Crowd-Sourcing Guided Labeling” and “Human-in-the-Loop Guided Labeling”.

Crowd-sourcing guided labeling: humans as weak label sources

Sometimes, manual labeling applied by a human is the only possible and feasible label source. In these cases it’s also likely that the labeling task will be quite difficult and that humans will make mistakes. This scenario is especially true when labels are crowd-sourced. What we mean here is when a generic user is asked to apply labels rather than a trusted in-house domain expert. In these cases you could consider human labeling a weak label source. More than one active learning application could be deployed simultaneously to a number of users, i.e. to domain experts. The domain experts would label more and more samples using active learning sampling. All provided labels are inserted into the same database queried by another system aggregating them in a weak label sources matrix. This other system can use the matrix and train the final model with weak supervision (Fig. 2).

Guided Labeling - Episode 8 - Combining Active Learning with Weak Supervision

Figure 2: Crowd-Sourcing Guided Labeling example showing how all labels from many different active learning applications can be aggregated in a single weak supervision model. This is extremely useful when the domain expert labeling work could be inaccurate and should be automatically compared to the work of another domain expert before providing it to the model.

Human-in-the-loop guided labeling: single interactive web based application

We have already seen how a domain expert can use labeling functions to provide labels. In this second Guided Labeling example we consider the case where the domain expert wants to:

  1. Provide labeling functions
  2. Train a model via weak supervision
  3. Inspect the predictions
  4. Edit the labeling functions
  5. Manually apply labels where it’s critical
  6. Retrain the model
  7. Repeat from step 3

This user journey is clearly a human-in-the-loop application, as the user is repeating tasks alternating her operation with the system. This setup offers two great opportunities to train a supervised model from an unlabeled dataset:

  • Huge quantities of labels for the evident samples via labeling functions;
  • Good quality of labels for the crucial samples via manual labeling.

Achieving both of the above is possible by combining weak supervision for the labeling functions and active learning for manual labeling. The manual labeling can be digested by the weak supervision training by simply considering it as another weak label source (Fig. 3).

Guided Labeling - Episode 8 - Combining Active Learning with Weak Supervision

Figure 3: Human-in-the-loop Guided Labeling example showing how the domain expert can provide labeling functions and manual labeling in a single human-in-the-loop application where the weak supervision model is trained each time the labeling functions are improved or more pure labels are provided where needed using active learning sampling.

Human-in-the-loop guided labeling for document classification

Via Guided Analytics we developed an interactive web based application which covers the human-in-the-loop Guided Labeling example. The domain expert can interact with a sequence of interactive view (Fig. 4) to:

  1. Upload documents
  2. Define the possible labels
  3. Provide initial labeling functions (e.g. “if [string] is in document apply [label]”)
  4. Train an initial weak supervision model
  5. Provide manual labels from Exploration-vs-Exploitation active learning sampling
  6. Edit labeling functions
  7. Repeat from Step 4 or end the application.
Guided Labeling - Episode 8 - Combining Active Learning with Weak Supervision

Figure 4: The Guided Analyticsapplication is made of a sequence of interactive views available via the KNIME WebPortal. The domain expert becomes part of the human-in-the-loop with Guided Labeling without being overwhelmed by the complexity of the KNIME workflow behind it.

An example of this kind of an application is available on the KNIME Hub as a workflow. You can download the free blueprint and customize it without any coding using KNIME Analytics Platform. To make the application accessible to your domain expert, you have to deploy it to KNIME Server. Once it is on KNIME Server, the application is available on any web browser via the KNIME Webportal.

Guided Labeling - Episode 8 - Combining Active Learning with Weak Supervision

Figure 5: The workflow available on the KNIME Hub. In the yellow box, you can see the entire workflow consisting of components, the active learning loop and the Exploration/Exploitation score combiner. The part of the workflow framed in red shows the inside of the metanode (circled by a red-dotted line) where weak supervision is trained.

The workflow behind the application (Fig. 5) includes KNIME components implementing each of the views, a Weak Label Learner and Gradient Boosted Tree Learner for the Weak Supervision training, and an Active Learning Loop to repeat the training process and Labeling View. To make the experience more interactive Tag Clouds showing document frequent terms and Network Viewers showing the correlation among labeling functions are made available to the user for inspection (Fig. 6).

Guided Labeling - Episode 8 - Combining Active Learning with Weak Supervision

Figure 6 : An animation showing the kind of interactivity available while running the Guided Labeling For Document Classification for sentiment label (“good” vs “bad”) of IMDb movie reviews via the KNIME WebPortal. Labeling with buttons, browsing documents via tag clouds, editing labeling functions and inspecting their correlations via a network view. This setup works well with document classification but many other visualizations can be combined depending on your needs.

We have reached the end of the Guided Labeling KNIME Blog Series, but you can still find more content about this topic. Watch our webinar on YouTube, for example, to see these workflows used in a live demo. Furthermore you can find more Guided Labeling, Active Learning and Weak Supervision examples on the KNIME Hub.

What’s next?

There are other strategies that could be added to the Guided Labeling approach (semi-supervised learning, transfer learning, more active learning strategies, more use cases, ..). If you have a proposal feel free to let us know via this KNIME Forum thread

The Guided Labeling KNIME Blog Series

By Paolo Tamagnini and Adrian Nembach (KNIME)


Integrated Deployment Blog Series - Episode 3: Automated Machine Learning

$
0
0
Integrated Deployment Blog Series - Episode 3: Automated Machine LearningpaolotamagMon, 08/31/2020 - 10:00

Welcome to the Integrated Deployment Blog Series, a series of articles focusing on solving the challenges around productionizing data science.

Automated Machine Learning

In the past two episodes we have seen how it is possible to use KNIME's Integrated Deployment approach to deploy a model. We have shown how to manually train a model and deploy it automatically before moving on to looking at automating the retraining of a previously selected model - leading to automated deployment.

Our previous integrated deployment examples are excellent for productionizing one single use case, i.e. one specified dataset with one specified categorical target. If you were to adapt our examples to your use case, it would work in production when the data and kind of prediction stay the same. However, if you were to add more data or even change what you are trying to predict you would find yourself having to change the workflow to reconfigure some of the node settings.

Wouldn’t it be great to have an Integrated Deployment strategy that automatically adapts itself when something changes?

A rhetorical question, of course it would be nice!

Automatic adaption to change

We are in fact talking about an automated machine learning (AutoML) solution for training and deploying machine learning classification models. Despite their popularity, AutoML solutions can be time consuming to implement and are only effective for a subset of machine learning problems.

In 2018, we released a complex Guided Automation workflow group designed to provide detailed coverage of the various aspects of AutoML - for example the user journey, complex interactive views, feature engineering, parameter optimization and machine learning interpretability. By the way - future plans for this large Guided Automation workflow include updating it to include Integrated Deployment strategies, too. But first, let’s address the problem that AutoML solutions are often complex to implement.

New AutoML component eases implementation of AutoML solutions

We have now developed a single component which flexibly automates the training, validation, and deployment of up to nine machine learning algorithms, combining them with any other required node. The new AutoML component, publicly available on KNIME Hub and part of a collection of Verified Components, can be easily dragged and dropped to your installation of KNIME Analytics Platform 4.2 or higher.

Integrated Deployment - Automated Machine Learning

Figure 1: Animation showing the  AutoML Verified Component being used.Training several models in KNIME Analytics Platforms has never been easier. After configuring and executing, inspect the results in an interactive view to monitor progress. The selected trained model can be used on a different dataset for additional testing via the Workflow Executor node. In this example, on a small dataset, the component automatically trains and outputs a Keras Deep Learning model on the fly for simple demo purposes.

Open source users can simply drag and drop the new component to KNIME Analytics Platform from the KNIME Hub and configure it just like any other Learner node (Fig. 1). The executing component goes through the various steps of the AutoML process based on the user settings specified in the component dialogue. At the end, the component automatically selects the best available model and it exports it as a deployment workflow via an Integrated Deployment connection.

Best practice: understanding the output

To manually use the component’s output as a black-box model, the user can simply add a Workflow Executor node and provide data. It is good practice to decipher the created machine learning black-box by combining the Workflow Executor node with other nodes from the Machine Learning Interpretability Extension and compute charts and explanations for the new predictions.

A more manual way to understand the component output is available by manually inspecting the actual workflow behind the model. This can be done with a Workflow Writer node. Optionally the user can already deploy the model by connecting a Deploy Workflow to Server node.

The component also offers an optional interactive view (Fig.2) which allows you to not only change the model selection but also inspect the performance of all the other models that were trained.

Integrated Deployment - Automated Machine Learning

Figure 2: The interactive view generated by the AutoML component: In the top part of the view an overview bar chart of computed performance metrics is shown and a table listing all successfully trained models. Both the bar chart and table are sorted using the user defined performance metrics, in this case “Accuracy”. The model automatically selected is the top one in the table, in this case “XGBoost Trees”. To change the model exported by the component the user has to perform a selection on the table and select “Apply” and “Close” in the bottom right hand corner of the view. Below a more advanced visualization is provided with ROC Curves and confusion matrices for each model (only available for binary classification).

Inspecting the workflow inside the AutoML component

The workflow inside the component can always be inspected and if needed customized. To organize its complexity we used so-called Nested Components for each different stage of the AutoML process.

The workflow inside the AutoML component starts with Configuration nodes. These are needed to expose settings and parameters to the user via the component dialogue (Fig. 3: A). After joining all the different flow variable settings in a single stream, the AutoML DataPrep (Fig. 3: B) handles automating missing value imputation, normalization and encoding of categorical features into numericals.

Based on the domain of the raw data and the user settings the data are prepared correctly and captured for later with Integrated Deployment. As a final step in the data preparation stage the dataset is split into train and test partitions. The prepared train data are passed to the AutoML Learner which trains the user-defined Machine Learning algorithms (Fig. 3: C1) with hyperparameter tuning using cross validation. If one of the models fails to train, by using Try and Catch Errors nodes (Fig. 3: C2), the Component discards them and keeps on training the remaining models. Once all models have been trained and captured via Integrated Deployment, the AutoML Learner exports a table storing the models. The said table is passed into the top port of the AutoML Predictor (Fig. 3: D); its second port receives the test data from AutoML Data Prep. 

Integrated Deployment - Automated Machine Learning

Figure 3: Illustrating the workflow inside of the AutoML component for training classifier models: The component dialogue (A) is generated by Configuration nodes; data preparation is automated depending on the proposed dataset and user settings in AutoML DataPrep Nested Component (B); the training of 9 different machine learning algorithms takes place in the AutoML Learner (C1) where each model parameter optimization takes place in a dedicated Meta Learner Sub-Nested Component (C2); trained models are applied to test data (D), scored against ground truth (E) and the best one is automatically selected (F). The final model is exported together with additional required workflow segments (e.g. required data preparation) as a deployment workflow thanks to Integrated Deployment.

Each of the models is then applied to the previously prepared test data and the predictions are passed from the AutoML Predictor to the AutoML Scorer so that the performance of each model can be measured (Fig. 3: E). Based on the metric selected by the user the best model is selected by AutoML Best Model (Fig. 3: F) and exported. Before exporting the model from the main AutoML component, a Workflow Combiner node is applied. We use Integrated Deployment to enhance the machine learning model by adding pre-process and post-process models to create a perfect deployment workflow.

The workflow exported by the AutoML component behaves like a black-box machine learning model: raw data goes in, predictions and raw data come out. The AutoML component output model (or workflow depending on the point of view) always guarantees the “black-box requirements”: no matter what was selected by the user in the component dialogue (e.g. a different model or a different kind of data preparation) the exported model is always able to process the raw data and append predictions at its output. This is possible thanks to the Integrated Deployment approach, which captures and combines the necessary pieces of workflow as needed. For example the AutoML component is now capable of training a Deep Learning model with the KNIME Deep Learning - Keras Integration. Exporting such a complex model as a deployment workflow (Fig. 4) is enabled with Integrated Deployment - capturing the Keras Network Executor node alongside any other nodes thus guaranteeing the black-box requirements.

Integrated Deployment - Automated Machine Learning

Figure 4: Keras Network Deployment workflow: The workflow depicted was automatically created by the AutoML component. It predicts churn in an example customer dataset. The workflow was written by the Workflow Writer node connected to the output of the AutoML Component. Providing a similar result manually would require a deep learning expert - and way more than just a few minutes.

The AutoML component currently addresses supervised learning for binary and multiclass classification topics. In future, we plan to update it and to release more compatible components that use Integrated Deployment.

Tip: When you use the AutoML component yourself keep it linked to make sure it is always updated with most recent version on KNIME Hub. Note that any new component that is released as part of our collection of Verified Components is a component developed by KNIME experts not merely as simple examples but with reliable functionalities to be used in the same way as you would use other standard KNIME nodes.

In the next episode in this blog series, we are going to use the AutoML component to create a Guided Analytics application via KNIME WebPortal. The application empowers anyone with a web browser to interactively control the settings of the AutoML component without requiring any knowledge of KNIME nodes and KNIME workflows. Stay tuned for our next episode!

Authors: Paolo Tamagnini & Mahantesh Pattadkal (KNIME) 

The Integrated Deployment KNIME Blog Series

Authors: Paolo Tamagnini & Mahantesh Pattadkal (KNIME)

Resources:

KNIME on Amazon EMR - Guide

$
0
0
KNIME on Amazon EMR - Guideandisa.dewiMon, 09/07/2020 - 10:00

Use this short guide to find out how to use KNIME Analytics Platform together with Amazon Elastic MapReduce. Learn how to connect to Amazon EMR and experiment using a real workflow. The example workflow demonstrates how to create a Spark context via Apache Livy and execute a simple Spark job on a cluster. The dataset behind the workflow is the NYC taxi datset.

Learn how to:

Set up an EMR cluster

Connect to S3

Run a Spark job on the EMR cluster

Work with Amazon Athena within KNIME Analytics Platform

Connect to Amazon Athena

Create an Athena Table

What is Amazon EMR?

Amazon EMR (Elastic MapReduce) is a managed cloud-based platform that provides big data frameworks, such as Apache Hadoop, or Apache Spark.

The benefits of this platform are:

  • Easy, fast, and cost-effective processing and analysis of vast amounts of data across dynamically scalable Amazon EC2 instances
  • Availability of other popular distributed frameworks such as Apache HBase, Presto, and Flink in Amazon EMR
  • Interaction with data in other AWS data stores such as Amazon S3

What are the KNIME Amazon Cloud Connectors?

KNIME Analytics Platform includes a set of nodes to interact with Amazon Web Services (AWS). They allow you to create connections to Amazon services, such as S3, AWS Comprehend, or AWS Translate.

The KNIME on Amazon EMR Guide

Note: To use this guide, you need an Amazon AWS account

Set up an EMR cluster

Prerequisites before launching an EMR cluster:

  • An Amazon AWS account. To sign up please go to this link and follow the instructions. 
  • An Amazon S3 bucket. The bucket is needed to exchange data between KNIME and Spark and to store the cluster log files. To create an Amazon S3 bucket, please follow this guide
For this guide, we recommend creating the cluster and the S3 bucket in the region eu-east-1, because later on we will read a dataset from the AWS Registry of Open Data which is located in that region. Having the cluster and data in the same region will avoid cross-region data transfer fees.

Now that all the prerequisites are fulfilled, it’s time to set up the EMR cluster:

1. In the AWS web console, go to EMR

2. Click the Create cluster button at the top of the page

KNIME on Amazon EMR
Figure 1. Create cluster button

3. While you’re in the cluster creation page, navigate to the Advanced options

KNIME on Amazon EMR
Figure 2. Advanced options


4. Under Software Configuration, you can choose the software to be installed within the cluster. For this guide, let’s check at least Hadoop, Hive, Spark, and Livy. 

KNIME on Amazon EMR
Figure 3. Software configuration
  • Go to Edit software settings. Here, you can override the default configurations of applications, such as Spark. In the example below, the spark property maximizeResourceAllocation is set to true to allow the executors to utilize the maximum resources possible on each node in a cluster. Please note that this feature works only on a pure Spark cluster (without Hive running in parallel).
  • You can keep the rest of the settings in this page by default and go to the next page.
KNIME on Amazon EMR
Figure 4. How to maximize resources on a Spark cluster 

5. Under Hardware Configuration, you can specify the EC2 instance types, number of EC2 instances to initialize in each node, and the purchasing option, depending on your budget. For this guide, it is enough to use the default configuration. The rest of the settings we can keep by default values, or adjust them according to your needs.

  • For more information on the hardware and network configuration, please check the EMR documentation. For a more in-depth guidance about the optimal number of instances, please check the guidelines as well. 
KNIME on Amazon EMR
Figure 5. Hardware configuration

6. Under General Options, enter the cluster name. Termination Protection is enabled by default and is important to prevent accidental termination of the cluster. To terminate the cluster, you must disable termination protection. 

7. Go to Security options, where there is an option to specify the EC2 key pair. For this guide we can proceed without an EC2 key pair, but if you do have one and you want to SSH into the EMR cluster later, you can provide it here.

  • Further down the page, you can also specify the EC2 security group. It acts as a virtual firewall around your cluster and controls all inbound and outbound traffic of your cluster nodes. A default EMR-managed security group is created automatically for your new cluster, and you can edit the network rules in the security group after the cluster is created. Follow the instructions in the documentation on how to work with EMR-managed security groups.

8. Click Create cluster and the cluster will be launched. It might take a few minutes until all the resources are available. You know the cluster is ready when there is a Waiting sign beside the cluster name (see Figure 6).

  • Now that we have a running EMR cluster, and an S3 bucket, we can go to KNIME Analytics Platform and start connecting!
KNIME on Amazon EMR
Figure 6. Cluster is ready

Connect to S3

The Amazon S3 Connection node configures and creates a connection to Amazon S3. In the node configuration dialog, you need to specify:

  • The authentication credentials. We strongly recommended using the access key ID and secret key. Follow the instructions in the documentation to get your credentials.
  • The IAM role name and account - if you want to switch to an IAM Role as well. For more information on switching to a role, please see the documentation.
  • The S3 region to store the buckets.
KNIME on Amazon EMR
Figure 7. Amazon S3 Connection node

After filling in all the information, test the connection by clicking the Test connection button in the configuration dialog. A new pop-up window will appear showing the connection information in the format of s3://accessKeyId@region and whether a connection was successfully established. 

Executing this node will establish a connection to Amazon S3. You can then use a variety of KNIME remote file handling nodes to manage files on Amazon S3.

The KNIME remote file handling nodes are available under IO > File Handling > Remote in the node repository.

Run a Spark job on the EMR cluster

Before we are able to run a Spark job on our new EMR cluster, we first need to create the Spark context. To create a Spark context via Livy in KNIME Analytics Platform, we can use the Create Spark Context (Livy) node.

Create Spark Context (Livy) node 

This node creates a Spark context via Apache Livy. The node has a remote connection port (blue) as input. The idea is that this node needs to have access to a remote file system to store temporary files between KNIME and the Spark context. 

A wide array of file systems are supported:

  • HDFS, webHDFS, httpFS, Amazon S3, Azure Blob Store, and Google Cloud Storage

However, please note that using, e.g HDFS is complicated on a remote cluster because the storage is located on the cluster, hence any data that is stored there will be lost as soon as the cluster is terminated.

  • The recommended and easy way is to use Amazon S3. 

In this guide we will use Amazon S3. For that, simply use the Amazon S3 Connection node as explained in the previous section and connect the output port of the Amazon S3 Connection node to the input port of the Create Spark Context node.

  • Further remote connection nodes are available under IO > File Handling > Remote > Connections in the node repository.

Moving on to the node configuration dialog. In this window you have to provide some information, the most important are:

  • The Spark version. The version has to be the same as the one used by Livy. Otherwise the node will fail. You can find the Spark version in the cluster summary page, or in the Software configuration step during cluster creation (see Figure 3) on the Amazon EMR web console.
  • The Livy URL including protocol and port e.g. http://localhost:8998. You can find the URL in the cluster summary page on the Amazon EMR web console (see Figure 8). Then simply attach the default port 8998 to the end of the URL.
KNIME on Amazon EMR
Figure 8. The Livy URL on the cluster summary page
  • Usually no authentication is required, so you can skip this part.
  • Under Advanced tab, there is an option to set the staging area for Spark jobs. For Amazon S3, it is mandatory to provide a staging directory.
KNIME on Amazon EMR
Figure 9. Create Spark Context (Livy) node

After the Create Spark Context node is executed, the output Spark node (gray) will contain the newly created Spark context. It allows you to execute Spark jobs via the KNIME Spark nodes

Example workflow: Connecting to Amazon EMR

KNIME on Amazon EMR
Figure 10: Overview of the workflow, Connecting to Amazon EMR

As an example, we can directly import the Taxi dataset located in a public S3 bucket from the Registry of Open Data on AWS into a Spark DataFrame, and perform some simple machine learning model training and prediction.

In the previous post of one of our cloud articles, KNIME on Databricks, we explained in more detail how to read and write data between a remote file system and Spark DataFrame via KNIME Analytics Platform.

Now that we have learned how to create an EMR cluster and execute a Spark job on it, let’s check out another Amazon service that utilizes Amazon S3 and can be used as a powerful data analytics tool.

In the next section, we will talk about Amazon Athena, an interactive query service for all your data that resides on S3.

Work with Amazon Athena within KNIME Analytics Platform

Amazon Athena is a query service where users are able to run SQL queries against their data that are located on Amazon S3. It is serverless and extremely fast. Athena runs standard SQL and supports standard data formats such as CSV, JSON, ORC, Avro, and Parquet. It is very important to note that Athena only reads your data, you can’t add or modify it. 

The idea of Athena is that basically databases and tables contain not the actual data, but only the metadata for the underlying source data. For each dataset, a corresponding table needs to be created in Athena. The metadata contains information such as the location of the dataset in Amazon S3, and the structure of the data, e.g. column names, data types, and so on. 

Connect to Amazon Athena

KNIME on Amazon EMR
Figure 11. Connecting to Athena

Connecting to Athena via KNIME Analytics Platform is fairly simple:

  1. Use the Amazon Authentication node to create a connection to AWS services. In this node please provide the AWS access key ID and secret access key. For more information about AWS access keys, see the AWS documentation.
  2. The Amazon Athena Connector node creates a connection to Athena through the built-in Athena JDBC driver. You just have to provide two information in the node configuration dialog:
  • The hostname of the Athena server. It has the format of athena..amazonaws.com. For example: athena.eu-west-1.amazonaws.com.
  • Name of the S3 staging directory where you want to store the query result. For example, s3://aws-athena-query-results-eu-west-1/.
KNIME on Amazon EMR
Figure 12. Athena Connector node

After we execute this node, a connection to Athena will be established. But before we can start querying data located in S3, we have to create a corresponding Athena table.

In this example, we will use the Amazon CloudFront log dataset which is a part of the public example Athena dataset made available at:

s3://athena-examples-/cloudfront/plaintext/

If your region is, let’s say, us-east-1, then the dataset would be available under:

s3://athena-examples-us-east-1/cloudfront/plaintext/.

Create an Athena table

To create an Athena table in KNIME Analytics Platform, simply enter the following CREATE TABLE statement in the node configuration dialog of DB SQL Executor node.

CREATE EXTERNAL TABLE IF NOT EXISTS cloudfront_logs (
  `Date` DATE,
  Time STRING,
  Location STRING,
  Bytes INT,
  RequestIP STRING,
  Method STRING,
  Host STRING,
  Uri STRING,
  Status INT,
  Referrer STRING,
  os STRING,
  Browser STRING,
  BrowserVersion STRING
) ROW FORMAT SERDE 'org.apache.hadoop.hive.serde2.RegexSerDe'
WITH SERDEPROPERTIES (
 "input.regex" = "^(?!#)([^ ]+)\\s+([^ ]+)\\s+([^ ]+)\\s+([^ ]+)\\s+([^ ]+)\\s+([^ ]+)\\s+([^ ]+)\\s+([^ ]+)\\s+([^ ]+)\\s+([^ ]+)\\s+[^\(]+[\(]([^\;]+).*\%20([^\/]+)[\/](.*)$"
) LOCATION 's3://athena-examples-<YOUR-REGION>/cloudfront/plaintext/';

Once the node is executed, the corresponding Athena table that contains metadata of the log files is created. Now you can query the files using the standard KNIME database nodes.

If you are not familiar with SQL and prefer to do it interactively, you can also create the table using the Athena web console. This way, you can even let AWS Glue Crawlers detect the file schema (column names, column types, etc) automatically instead of entering them manually.
  • Follow the tutorial in the Athena documentation for a more in-depth explanation on using AWS Glue Crawlers

Wrapping Up

We have learned how to create an Amazon EMR Spark cluster, connect to it via Apache Livy, and execute a Spark job on top of the cluster from within KNIME Analytics Platform. We also learned about Amazon Athena and showed how to work with Athena via KNIME Analytics Platform.

Hopefully this guide can help you get a quick start into Amazon EMR and Amazon Athena.

Tune in to more articles in this series on KNIME and cloud connectivity. See links to further blog articles on this topic below.

Image
KNIME on Amazon EMR - Cloud Connectors
Image style
Large
Andisa Dewi

Text Mining Use Cases plus Deep-Dive into Techniques

$
0
0
Text Mining Use Cases plus Deep-Dive into TechniquesRedfieldThu, 09/10/2020 - 10:00

Text mining is an efficient data analysis technique to use if you need to not only get a quick sense of the content of specialized documents, but also understand key terms and topics, and reveal hidden relations. 

All kinds of different analysis opportunities are opened up by text mining techniques. Natural Language Processing (NLP), topic modeling, sentiment and network analysis - all text mining techniques - can be used effectively in areas such as marketing (analysis of online customer interactions), politics (analysis of political speeches to ascertain party alignment), technology (assessment of COVID-19 app acceptance), research (publication biases), and electronic records (e.g., email, messaging, document repositories), spam filtering, fraud detection, alternative facts detection, as well as Q&A.

However, extracting the valuable information that is potentially hidden in the textual data and depicting relations among the textual data explicitly, for example by visually representing key attributes of the text in relation to industry standards can pose quite a challenge. Overcoming this challenge is important for organizations to stay competitive.

Webinar about text mining techniques

The team of data scientists at Redfield has put together a webinar about text mining that addresses these challenges. The webinar is split into two parts:

  1. An overview of the range of insights and knowledge that can be mined from text, providing business cases to highlight this.
  2. Demonstration of a practical example of a KNIME workflow in order to:
  • Gain insights from a collection of documents about chemical compounds
  • Identify in which documents a specific chemical compound is mentioned
  • Specify the topics of the selected documents
  • Reveal what is common among two documents by building a knowledge graph from domain specific documents

Gain insight and visualize findings

At the webinar, the Redfield team will be blending multiple Natural Language Processing (NLP) techniques and presenting the results in different output formats such as tables, graphs, also highlighting text as shown in the screenshots to help the user make sense of the information contained in the original text collection.

Text Mining Use Cases plus Deep Dive into Techniques

Fig. 1 Summary of topic modeling application to our text collection: list of topics with their label, list of terms and number of documents assigned to that topic as the majority topic.

Text Mining Use Cases plus Deep Dive into Techniques

Fig. 2 Visualization of Named Entity mentions and links. Each named entity is shown in a different color. Chemical compounds, for example, are shown in gray. These types of named entities are also automatically linked to the Wikipedia article about the respective chemical compound.

Fig. 3 Visualization of documents with their topics, topic terms, and named entities in Neo4j.

Use case: KNIME workflow for building a knowledge graph

The Redfield team will walk you through a KNIME workflow to build a Knowledge Graph, which consists of the following main steps:

  1. Retrieving the documents about a specific topic from a SPARQL endpoint
  2. Applying Named Entity Recognition and Linking, as well as Topic Modeling
  3. Populating our SQL and external (Neo4J) Graph databases
  4. Performing interactive named entity and document selection and table + graph visualization

The webinar in practice

The webinar is aimed at data scientists or business user/domain experts. It is designed for KNIME users who wish to get acquainted with more complex KNIME workflows that integrate multiple heterogeneous NLP and data science tasks.

Key takeaways for this session are:

  1. You will blend several NLP techniques to build a Knowledge Graph for a collection of documents within a KNIME workflow
  2. You will build interactive visualizations for text highlighting and relation finding between documents.
  3. We will provide a simplified version of the workflow for the users to download and play with.

The webinar presenters

Jan Lindquist is a data scientist leader at Redfield. He helps customers deploy KNIME Server on AWS. He also performs GDPR privacy assessments and standardization work to improve data governance through tools like KNIME and the KNIME privacy extensions.

Artem Ryasik has an academic background in life science and a PhD in biophysics. He works as a data scientist at Redfield. Projects include graph analysis, recommendation engines and data anonymization. When time permits he develops KNIME node extensions such as the OrientDB and Privacy nodes based on ARX open source software. He also teaches KNIME courses in Nordics.

Nadjet Bouayad-Agha holds a PhD in Natural Language Processing and has many years of experience in the field, as an R&D academic and in later years as a Freelance Consultant. She is particularly interested in Natural Language Generation, Ontologies, the Semantic Web and the use of Deep Learning/Machine Learning for resolving NLP problems.

Blog
Nadjet Bouayad-Agha &  Artem Ryasik &  Jan Lindquist

Will They Blend? 2nd Edition - Data Blending with KNIME - Expanded and Updated

$
0
0
Will They Blend? 2nd Edition - Data Blending with KNIME - Expanded and UpdatedLadaMon, 09/14/2020 - 10:00

Data Blending is a Challenge … Or Is It?

Data often reside on different dislocated data sources: on your machine, in the cloud, in a remote database, on a web service, on social media, on hand-written notes (sigh…), in pdf documents - the list goes on and on.

One challenge all data scientists therefore encounter is accessing data of different types from different data sources and blending them together in a single data table to pass on to the next steps of the data analysis. Once the data have been collected and blended and are ready for pre-processing, analysis, and visualization, it is time to choose the technique for the particular task.

Which technique will it be?

One that is already embedded in KNIME Analytics Platform or a technique available in an external tool like Google API, Amazon ML Services, or Tableau, for example? Does part of your workflow need to run in R or Python? Do you need a combination of everything?

Seems like tool blending is another challenge that data scientists can encounter. But are data blending and tool blending really challenges? We argue that, for KNIME Analytics Platform, blending is not challenging at all.

To prove that, the “Will They blend?” e-book gathers together a variety of stories answering the questions on how to access data from different sources, how to blend them, and analyze using a variety of instruments.The first edition of the “Will They blend?” e-book was written in 2018. In terms of data storage and data science technology this is already quite a long time ago. Therefore, we have now updated and expanded the blending stories in it to the newest KNIME nodes and features as of KNIME Analytics Platform 4.2.

Eleven new chapters describe connectors to more than 20 additional data sources, web services, and external tools, as introduced in the most recent versions of KNIME Analytics Platform and KNIME Server

Will They Blend - Data Blending with KNIME
  • The second edition of the “Will they blend?” e-book is hot off the press and free to download from the KNIME Press page.
  • It now contains 32 chapters describing data blending for more than 50 data sources and external tools, from classic and new databases to cloud resources, from Sharepoint and SAP to web services and social media.
  • Download the free ebook Will They Blend? Data Blending with KNIME

Jump to summaries of the new chapters in the book by clicking the links below:

The latest additions: Sharepoint, SAP, DynamoDB

Sharepoint

SharePoint is one of the latest integrations in the new File Handling Framework. The chapter “Microsoft Sharepoint meets Google Cloud Storage” shows an example workflow that connects to Sharepoint using the new SharePoint Online Connector node and connects to Google Cloud Storage to subsequently generate personalized invoices. Here you can see how the SharePoint Online Connector node manages, reads, and writes files to/from SharePoint within KNIME Analytics Platform (Fig. 1).

This example workflow, Microsoft Sharepoint meets Google Cloud Storage, blends the data, preprocesses the table into a shape that fits an invoice report, and exports the table into a pdf document with a custom title and footer. The procedure is automatically repeated for all orders in the data.

Will They Blend - Data Blending with KNIME - 2nd Edition
Figure 1. Blending data from Google Cloud Storage and Microsoft Sharepoint.

SAP 

As of KNIME Analytics Platform 4.2, you need just one dedicated node - the SAP Reader (Theobald) to extract data from various SAP systems. In order to develop such a node, KNIME partnered with Theobald Software, one of the world’s leading experts in SAP integration. In the chapter “Theobald meets SAP HANA”, we access features of the ordered items using the new node and blend them with submitted orders data retrieved using a sequence of traditional DB nodes. After blending, we build an interactive KPI dashboard.

DynamoDB

The Amazon DynamoDB nodes allow you to seamlessly access and manipulate your data and tables in Amazon DynamoDB. The chapter “Amazon S3 Meets DynamoDB. Combining AWS Services to Access and query data” accesses data on Amazon S3, loads them directly to Amazon DynamoDB and performs various ETL operations using dedicated DynamoDB nodes.. 

Cloud sources: Amazon S3, MS BlobStorage, Snowflake, Google BigQuery, Databricks

Do you store your data on the cloud? Which of the many cloud options do you use? 

Amazon S3 and MS BlobStorage

If you keep your data in Amazon S3 or in Microsoft Azure Blob Storage, the story “Amazon S3 meets MS Azure Blob Storage. A Match made in the Clouds.” blends data from both sources to analyze commuting time of workers. 

Snowflake

Another option is Snowflake– a Software as a Service (SaaS) cloud data platform that can be deployed on Azure, AWS, or GCP globally. The updated story “Snowflake meets Tableau. Data warehouse in an hour?” is a detailed guide on how to start with Snowflake, download and register the JDBC driver and connect using the generic DB Connector node.

Google BigQuery & Databricks

If you want to access publicly available datasets from such rich storage platforms as Google BigQuery, you should definitely check the new story “Google BigQuery meets Databricks. Shall I rent a bike with this weather?”. First, it is environmentally friendly because it inspects the influence of weather on bike sharing usage. Second, it is also user friendly because it provides tips for connecting to Google BigQuery with the Google Authentication (API Key) and dedicated Google BigQuery Connector nodes and to Databricks– another cloud-based analytics tool for big data – with the Create Databricks Environment node.

Vendor neutral big data nodes

If you are interested in more opportunities to access, transform, and analyze big data, the stories, “Hadoop Hive meets Excel. Your Flight is boarding now!” and “SparkSQL meets HiveQL. Women, Men, and Age in the State of Maine” will guide you through. We use the Local Big Data Environment node for simplicity. It is very easy to use and play with if you want to quickly implement a prototype with various Spark nodes. But when you store big data, for example, on a Cloudera cdh5.8 cluster running on the Amazon cloud, you can simply replace the Local Big Data Environment node with the dedicated Hive Connector node. Or other KNIME Big Data connectors.

Databases: SQL and NoSQL

The joke that database admins couldn’t find a table in a NoSQL bar wouldn’t be that funny if its authors knew what KNIME Analytics Platform is capable of when it comes to blending. In the story “Blending Databases. A Database Jam Session.”, KNIME handles not only blending five SQL databases (PostgreSQL, MySQL, MariaDB, MS SQL Server and Oracle) but also one NoSQL database (MongoDB). As a result, the different customer data are aggregated in a single KNIME table that is then ready for further analysis. Could we blend even more databases? Sure. Just look for a dedicated connector node! If you can’t find one – download the JDBC driver for your favorite database, register it in KNIME Analytics Platform and use the generic nodes from the DB section in the Node Repository.

Special files: ZIP archives, web crawling, Google Sheets, MDF and more

Local and Remote ZIP files

Sometimes you need to blend data where some files are remote and some are saved locally. The story “Local vs. Remote Files. Will Blending Overcome the Distance?” blends remote and local ZIP archives to blend flight data from different periods of time in one bar chart for comparison.

Web Crawling & MS Word

Another close example is blending unstructured text data from the web and from a MS Word file. “MS Word meets Web Crawling. Identifying the Secret Ingredient.” is definitely our tastiest story – it successfully blends different Christmas cookies recipes to discover the secret ingredient! We know it is summer now, but who said that you can’t use this workflow to hunt for some hot summer lemonade secret ingredient?

Excel Files and Google Sheets

It probably should go without saying that such a powerful data analytics tool as KNIME can easily blend Excel files and Google Sheets, but, just in case, we have an example of this too! Check the “A Recipe for Delicious Data: Mashing Google and Excel Sheets”.

Text and Images

You might think that these formats are not that difficult to blend. Then, let’s take up something more challenging and blend something really different! For example, an image and a text. “Kindle epub meets Image JPEG. Will KNIME make peace between the Capulets and the Montagues?” The workflow described in this chapter blends one of the saddest books in the world (in our case, in epub format) with the photos from the Romeo and Juliet play into a network that shows a clear separation between the two families (they are the only ones in our book who don’t blend).

Handwritten Notes and Semantic Web

Another challenging story is “OCR on Xerox Copies meets Semantic Web. Have Evolutionary Theories Changed?”. It again successfully blends text data: one is stored in the pdf file and other – in the Semantic Web. The first is achieved by performing Optical Character Recognition with the Tess4J node, the second – with SPARQL Endpoint and SPARQL query nodes. If you want to learn more about querying Semantic Web OWL (Web Ontology Language) files, the new story “KNIME Meets the Semantic Web. Ontologies – or let’s see if we can serve pizza via the semantic web and KNIME Analytics Platform” will teach you how Triple File Reader node can help pizza experts extract some yummy data!

Apache Kafka and MDF

Excel, Word, PDF… tough automotive industry engineers may have gotten bored already… They probably think: “How about sensor measurements data, for example, for new engines testing?” Don’t get bored – KNIME has a solution for that too! The new story “MDF meets Apache Kafka. How’s the engine doing?” shows how to read MDF file format with the MDF Reader node, how to access the measurements data stored in a Cluster of the streaming platform Apache Kafka with Kafka Connector and Kafka Consumer nodes, and, of course, how to blend the measurements into the line chart for efficient testing of the new engine.

Web Services and Social Media: Google API, Amazon ML Services, Azure Cognitive Services, Twitter

Google API

Google API are very popular web services. You can get all sorts of information from them, like news, translations, youtube analytics, or pure search results.

We already mentioned Google API for retrieving public data from Google BigQuery and news from Google News. Another four stories involving Google API are: 

  • “Finnish Meets Italian and Portuguese through Google Translate API. Preventing Weather from Getting Lost in Translation.”
  • “IBM Watson meets Google API”.

Amazon ML Services

By the way, as for automatic translation, one possible alternative to Google Translate API is Amazon Machine Learning (ML) Services which include a translation service. The new story “Amazon ML Services meets Google Charts. Travel Risk Guide for Corporate Safety” estimates travel risks: first, on a global level by visualizing the risks for each country on a Google world map using the Choropleth World Map component; and then, by analyzing local news for a particular country of interest. This is where Amazon Authentication and Amazon Translate nodes come into play: they help to translate local news to the desirable language. But it is not all: the workflow also applies Amazon Comprehend nodes to estimate the sentiment of the news alerts and extract key phrases, for example. As a result, Google charts and Amazon ML Services blend in one travel risk guide (Fig. 2).


Figure 1. Blending data from Google Cloud Storage and Microsoft Sharepoint.
Figure 2. Our travel risk guide visualizes the risk levels in each country in a choropleth map based on Google Charts and shows information extracted from local news and analyzed with Amazon ML Services.

Azure Cognitive Services and Twitter

We’ve also got a story for those who prefer to conduct their sentiment analysis with Microsoft Azure instead of Amazon. The new story “Twitter and Azure. Sentiment Analysis via API.” extracts tweets with Twitter API Connector and Twitter Search nodes and passes them into Azure Cognitive Services using POST Request node. By the way, since Twitter only allows your to extract recent tweets, you might be interested in the “Twitter meets PostgreSQL. More Than Idle Chat?” story, which blends recent data from Twitter with the older data stored in, for example, a PostgreSQL database.

Data Science Tools and Reporting Tools: R, Python, Tableau, BIRT

Tableau and BIRT

The Tableau integration has also been updated and now builds on the new Tableau Hyper API to ensure better compatibility and easy installation. Check the new node Tableau Writer in the updated “BIRT meets Tableau and JavaScript. How Was The Restaurant?” story.

Python and R

Of course, we could not pass by fans of writing a piece of code themselves. In our story “A Cross-Platform Ensemble Model. R Meets Python and KNIME. Embrace Freedom in the Data Science Lab!”, we easily integrate two programming languages most beloved by data scientists into the KNIME Analytics Platform to train classical machine learning classification models on R, Python and KNIME. For that, we just need dedicated Python Learner, Python Predictor, R Learner and R Predictor nodes. We then ensemble predictions obtained from three different platforms using just one Prediction Fusion node. Isn’t it a fantastic blending?

Stay tuned!

To sum up, the second edition of the “Will They Blend” e-book is now available for download after updating and expanding it for KNIME Analytics Platform 4.2. 

The updating procedure was quite a massive amount of work. We replaced deprecated and legacy nodes (even though all deprecated and legacy nodes still work and process your data without any changes), replaced deprecated services, and replaced the public data that disappeared from the web within 2 years.

We expanded the e-book with new stories including those with the latest nodes: SharePoint Online Connector, SAP Reader (Theobald), Amazon DynamoDB and Tableau Writer. One of the stories we are aiming to write next is about newly created dedicated Salesforce nodes. What could we blend them with… ?

Like all e-books in KNIME Press, Will They Blend? is a live e-book. Every time a connector to a new data source is made available in a new release of KNIME Analytics Platform and an example workflow is created, the respective story is added to the PDF document.

Blog
Image
Will They Blend - Data Blending with KNIME
Image style
Large
Lada Rudnitckaia &  Rosaria Silipo

Cohen's Kappa: what it is, when to use it, how to avoid pitfalls

$
0
0
Cohen's Kappa: what it is, when to use it, how to avoid pitfallsMaaritMon, 09/21/2020 - 10:08

As first published in The New Stack.

Cohen’s kappa is a metric often used to assess the agreement between two raters. It can also be used to assess the performance of a classification model.

For example, if we had two bankers, and we asked both to classify 100 customers in two classes for credit rating, i.e. good and bad, based on their creditworthiness, we could then measure the level of their agreement through Cohen's kappa. 

Similarly, in the context of a classification model, we could use Cohen’s kappa to compare the machine learning model predictions with the manually established credit ratings.

Like many other evaluation metrics, Cohen’s kappa is calculated based on the confusion matrix. However, in contrast to calculating overall accuracy, for example, Cohen’s kappa takes imbalance in class distribution into account and can therefore be more complex to interpret.

In this article we will:

  • Guide you through the calculation and interpretation of Cohen’s Kappa values, particularly in comparison with overall accuracy values
  • Show that where overall accuracy fails because of a large imbalance in the class distribution, Cohen’s kappa might supply a more objective description of the model performance
  • Introduce a few tips to keep in mind when interpreting Cohen’s kappa values!

Measuring Performance Improvement on Imbalanced Datasets

Let’s focus on a classification task on bank loans, using the German credit data provided by the UCI Machine Learning Repository. In this dataset, bank customers have been assigned either a “bad” credit rating (30%) or a “good” credit rating (70%) according to the criteria of the bank. For the purpose of this article, we exaggerated the imbalance in the target class credit rating via bootstrapping, giving us 10% with a “bad” credit rating and 90% with a “good” credit rating: a highly imbalanced dataset. Exaggerating the imbalance helps us to make the difference between “overall accuracy” and “Cohen’s kappa” clearer in this article.

Let’s partition the data into a training set (70%) and a test set (30%) using stratified sampling on the target column and then train a simple model, a decision tree, for example. Given the high imbalance between the two classes, the model will not perform too well. Nevertheless, let’s use its performance as the baseline for this study.

Baseline model

In figure 1 you can see the confusion matrix and accuracy statistics for this baseline model. The overall accuracy of the model is quite high (87%) and hints at an acceptable performance by the model. However, in the confusion matrix, we can see that the model is able to classify only 9 out of the 30 credit customers with a bad credit rating correctly. This is also visible by the low sensitivity value of class “bad” - just 30%.

Basically, the decision tree is classifying most of the “good” customers correctly and neglecting the necessary performance on the few “bad” customers. The imbalance in the class a priori probability compensates for such sloppiness in classification. Let’s note for now that Cohen's kappa value is just 0.244, within its range of [-1,+1].

A Guide to Using Cohen's Kappa
Figure 1: Confusion matrix and accuracy statistics for the baseline model, i.e. a decision tree model trained on the highly imbalanced training set. The overall accuracy is relatively high (87%), although the model detects just a few of the customers with a bad credit rating (sensitivity just at 30%).

Improved model

Let’s try to improve the model performance by forcing it to acknowledge the existence of the minority class. We train the same model this time on a training set where the minority class has been oversampled using the SMOTE technique, reaching a class proportion of 50 % for both classes.

To provide more detail about the confusion matrix for this model, 18 out of the 30 customers with a “bad” credit rating are detected by the model, leading to a new sensitivity value of 60% over the previous 30%. Cohen’s kappa statistics is now 0.452 for this model, which is a remarkable increase from the previous value 0.244. But what about overall accuracy? For this second model it’s 89%, not very different from the previous value 87%. 

When summarizing we get two very different pictures. According to the overall accuracy, model performance hasn’t changed very much at all. However, according to Cohen’s kappa a lot has changed! Which statement is right?

A Guide to Using Cohen's Kappa
Figure 2: Confusion matrix and accuracy statistics for the improved model. The decision tree model trained on a more balanced training set, where the minority class has been oversampled. The overall accuracy is almost the same as for the baseline model (89% vs. 87%). However, Cohen's kappa value shows a remarkable increase from 0.244 to 0.452.

From the numbers in the confusion matrix, it seems that Cohen’s kappa has a more realistic view of the model’s performance when using imbalanced data.

  • Why does Cohen’s kappa take more notice of the minority class? How is it actually calculated? Let’s take a look!

Cohen’s kappa 

Cohen’s kappa is calculated with the following formula [1]:

A Guide to Using Cohen's Kappa

where p0is the overall accuracy of the model and pe is the measure of the agreement between the model predictions and the actual class values as if happening by chance. 

In a binary classification problem, like ours, pe is the sum of pe1, the probability of the predictions agreeing with actual values of class 1 (“good”) by chance, and pe2, the probability of the predictions agreeing with the actual values of class 2 (“bad”) by chance. Assuming that the two classifiers - model predictions and actual class values - are independent, these probabilities, pe1 and pe2, are calculated by multiplying the proportion of the actual class and the proportion of the predicted class. 

Considering “bad” as the positive class, the baseline model (Figure 1) assigned 9% of the records (false positives plus true positives) to class “bad”, and 91% of the records (true negatives plus false negatives) to class “good”. Thus pe is:

A Guide to Using Cohen's Kappa

And therefore Cohen’s kappa statistics:

A Guide to Using Cohen's Kappa

which is the same value as reported in figure 1.

Practically, Cohen’s kappa removes the possibility of the classifier and a random guess agreeing and measures the number of predictions it makes that cannot be explained by a random guess. Furthermore, Cohen’s kappa tries to correct the evaluation bias by taking into account the correct classification by a random guess.

Pain Points of Cohen’s Kappa

At this point, we know that Cohen’s kappa is a useful evaluation metric when dealing with imbalanced data. However, Cohen’s kappa has some downsides, too. Let’s have a look at them one by one.

Full range [-1, +1], but not equally reachable

It’s easier to reach higher values of Cohen’s kappa, if the target class distribution is balanced. 

For the baseline model (Figure 1), the distribution of the predicted classes follows closely the distribution of the target classes: 27 predicted as “bad” vs. 273 predicted as “good” and 30 being actually “bad” vs. 270 being actually “good”. 

For the improved model (Figure 2), the difference between the two class distributions is greater: 40 predicted as “bad” vs. 260 predicted as “good” and 30 being actually “bad” vs. 270 being actually “good”. 

As the formula for maximum Cohen’s kappa shows, the more the distributions of the predicted and actual target classes differ, the lower the maximum reachable Cohen’s kappa value is. The maximum Cohen’s kappa value represents the edge case of either the number of false negatives or false positives in the confusion matrix being zero, i.e. all customers with a good credit rating, or alternatively all customers with a bad credit rating, are predicted correctly.

A Guide to Using Cohen's Kappa

where pmax is the maximum reachable overall accuracy of the model given the distributions of the target and predicted classes:

A Guide to Using Cohen's Kappa

For the baseline model, we get the following value for pmax:

A Guide to Using Cohen's Kappa

Whereas for the improved model it is:

A Guide to Using Cohen's Kappa

The maximum value of Cohen’s kappa is then for the baseline model:

A Guide to Using Cohen's Kappa

For the improved model it is:

A Guide to Using Cohen's Kappa

As the results show, the improved model with a greater difference in the distributions between the actual and predicted target classes can only reach a Cohen's kappa value as high as 0.853. Whereas the baseline model can reach the value 0.942, despite the worse performance.

Cohen’s kappa is higher for balanced data

When we calculate Cohen’s kappa, we strongly assume that the distributions of target and predicted classes are independent and that the target class doesn’t affect the probability of a correct prediction. In our example this would mean that a credit customer with a good credit rating has an equal chance of getting a correct prediction as a credit customer with a bad credit rating. However, since we know that our baseline model is biased towards the majority “good” class , this assumption is violated.

If this assumption were not violated, like in the improved model where the target classes are balanced, we could reach higher values of Cohen’s kappa. Why is this? We can rewrite the formula of Cohen’s kappa as the function of the probability of the positive class, and the function reaches its maximum when the probability of the positive class is 0.5 [1]. We test this by applying the same improved model (figure 2) to different test sets, where the proportion of the positive “bad” class varies between 5% and 95%. We create 100 different test sets per class distribution by bootstrapping the original test data, and calculate the average Cohen’s kappa value from the results. 

Figure 3 shows the average Cohen’s kappa values against the positive class probabilities - and yes! Cohen’s kappa does reach its maximum when the model is applied to balanced data!

A Guide to Using Cohen's Kappa
Figure 3. Cohen’s kappa values (on the y-axis) obtained for the same model with varying positive class probabilities in the test data (on the x-axis). The Cohen’s kappa values on the y-axis are calculated as averages of all Cohen’s kappas obtained via bootstrapping the original test set 100 times for a fixed class distribution. The model is the Decision Tree model trained on balanced data, introduced at the beginning of the article (Figure 2).

Cohen’s kappa says little about the expected prediction accuracy

The numerator of Cohen’s kappa, p0-pe tells the difference between the observed overall accuracy of the model and the overall accuracy that can be obtained by chance. The denominator of the formula, 1-pe, tells the maximum value for this difference. 

For a good model, the observed difference and the maximum difference are close to each other, and Cohen’s kappa is close to 1. For a random model, the overall accuracy is all due to the random chance, the numerator is 0, and Cohen’s kappa is 0. Cohen’s kappa could also theoretically be negative. Then, the overall accuracy of the model would be even lower than what could have been obtained by a random guess.

Given the explanation above, Cohen’s kappa is not easy to interpret in terms of an expected accuracy, and it’s often not recommended to follow any verbal categories as interpretations. For example, if you have 100 customers and a model with an overall accuracy of 87 %, then you can expect to predict the credit rating correctly for 87 customers. Cohen’s kappa value 0.244 doesn’t provide you with an interpretation as easy as this. 

Summary

In this article we have explained how to use and interpret Cohen’s kappa to evaluate the performance of a classification model. While Cohen’s kappa can correct the bias of overall accuracy when dealing with unbalanced data, it has a few shortcomings. So the next time you take a look at the scoring metrics of your model, remember:

  1. Cohen’s kappa is more informative than overall accuracy when working with unbalanced data. Keep this in mind when you compare or optimize classification models!
  2. Take a look at the row and column totals in the confusion matrix. Are the distributions of the target/predicted classes similar? If they’re not, the maximum reachable Cohen’s kappa value will be lower.
  3. The same model will give you lower values of Cohen’s kappa for unbalanced than for balanced test data.
  4. Cohen’s kappa says little about the expected accuracy of a single prediction 

Example workflow - Cohen's Kappa for Evaluating Classification Models

The workflow used for this study is shown in Figure 4. In the workflow we train, apply, and evaluate two decision tree models that predict the creditworthiness of credit customers. In the top branch, we train the baseline model, while in the bottom branch we train the model on the bootstrapped training set using the SMOTE technique.

A Guide to Using Cohen's Kappa
Figure 4: This KNIME workflow trains two decision trees to predict the credit score of customers. In the top branch, a baseline model is trained on the unbalanced training data (90% “good” vs. 10% “bad” class records). In the bottom branch, an improved model is trained on a new training dataset where the minority class has been oversampled (SMOTE) . The workflow Cohen’s Kappa for Evaluating Classification Models is available on the KNIME Hub.

References

[1] Bland, Martin. "Cohen’s kappa." University of York Department of Health Sciences https://www-users.york.ac.uk/~mb55/msc/clinimet/week4/kappa_text.pdf. [Accessed May 29 2020] (2008).

Blog
Image
Cohen's Kappa: what it is, when to use it, how to avoid pitfalls
Image style
Fullwidth
Maarit Widmann

Easy Interpretation of a Logistic Regression Model with Delta-p Statistics

$
0
0
Easy Interpretation of a Logistic Regression Model with Delta-p StatisticsMaaritMon, 09/28/2020 - 10:00

Key Takeaways

  • With Delta-p statistics, the predictions based on a logistic regression model are easy to understand by non-technical decision-makers.
  • Learn how to calculate the Delta-p statistics based on the coefficients of a logistic regression model for credit application processing.
  • Data workflow includes the steps for accessing the raw data to training the logistic regression model, and evaluating the effects of individual predictor columns with Delta-p statistics.
  • Keep in mind logistic regression might not be the best choice when working with high dimensional data, with many correlated predictor columns.

Imagine a situation where a credit customer applies for a credit, the bank collects data about the customer - demographics, existing funds, and so on - and predicts the credit-worthiness of the customer with a machine learning model. The customer’s credit application is rejected, but the banker doesn’t know why exactly. Or, a bank wants to advertise their credits, and the target group should be those who eventually can get a credit. But who are they?

In these kinds of situations, we would prefer a model that is easy to interpret, such as the logistic regression model. Delta-p statistics make interpretation of the coefficients even easier. With Delta-p statistics at hand, the banker doesn’t need a data scientist to be able to inform the customer, for example, that the credit application was rejected, because all applicants who apply credit for education purposes have a very low chance of getting a credit. The decision is justified, the customer is not personally hurt, and he or she might come back in a few years to apply for a mortgage.

In this article, we explain how to calculate the Delta-p statistics based on the coefficients of a logistic regression model. We demonstrate the process from raw data to model training and model evaluation with a KNIME workflow where each intermediate step has a visual representation. However, the process could be implemented in any tool.

Assessing the Effect of a Single Predictor with the Delta-p Statistics

Logistic Regression Model

When we use the logistic regression algorithm for classification, we model the probability of the target class, for example, the probability of a bad credit rating, with a logistic function. Let’s say we have a binomial logistic regression model with a target column y, credit rating, with two classes that are represented by 0 (good credit rating) and 1 (bad credit rating). The log odds of the target class (y=1) vs. the reference class (y) is a linear combination βx of the predictor columns x (account balance, credit duration, credit purpose, etc.). A logistic function of βx transforms the log odds into a probability of the target class:

Easy Interpretation of a Logistic Regression Model with Delta-p

where β is the vector of coefficients for the predictor columns xin the logistic regression model that predicts the target class y.

The target and reference classes can be arbitrarily chosen. In our case, the target class is “bad credit rating,” and the reference class is “good credit rating.”

Delta-p Statistics

If the single predictor column xi is continuous, the coefficient βicorresponds to the change in the log odds of the target class when xi increases by 1. If xi is a binomial column, the coefficient value βi is the change in the log odds when xi changes from 0 to 1. The change in the probability of the target class is provided by the logistic function, as shown in Figure 1.

Easy Interpretation of a Logistic Regression Model with Delta-p

Figure 1. Logistic function modeling the probability of the target class y=1 as a function of one continuous predictor column xi

The Delta-p statistics transforms the coefficient values βi into percentage effects of single predictor columns to the probability of the target class compared to an average data point e.g., an average credit applicant.

By definition, the Delta-p statistic is a measure of the discrete change in the estimated probability of the occurrence of an outcome given a one-unit change in the independent variable of interest, with all other variables held constant at their mean values. For example, if the Delta-p value of a predictor column xi is 0.2, then a unit increase in this column (or a change from 0 to 1 in a binomial column) increases the probability of the target class by 20 %. The following formulas show how to calculate the prior and post probabilities of the target class and, finally, the Delta-p statistics as their difference1:

Easy Interpretation of a Logistic Regression Model with Delta-p

Use Case: The Effect of Credit Purpose and Current Account Balance on Credit Rating

Let’s now demonstrate this with an example, and check how the credit purpose and balance of an existing account improves or worsens the credit rating. We use the German credit card data provided by the UCI Machine Learning Repository. The dataset contains 21 columns that provide information about demographics and economic conditions of 1,000 credit applicants. Thirty percent of the applicants have a bad credit rating, and 70 % have a good rating. You can download the data in .data format by clicking “Data Folder” on top of the page, and selecting the “german.data” item on the next page. The german.data file can be opened in a text editor and saved, for example, in csv format. The column names and descriptions of the values in the categorical columns are provided in the german.doc file, accessible via the same “Data Folder” page.

The workflow in Figure 2 shows the process from accessing the raw data to training the logistic regression model, and evaluating the effects of individual predictor columns with Delta-p statistics.

The process is divided into the following steps, each one implemented within a separate colored box: Accessing data (1), preprocessing data as required by a logistic regression model (2), training the model (3), and calculating the Delta-p statistics based on the model coefficients (4). In the preprocessing step, we convert the target column from the 1/2 notation to “bad”/“good.” We also transform two originally multinomial columns into binomial columns: We encode the “checking” column into two values “negative”/“some funds or no account” based on the status of the existing bank account. We encode the “purpose” column into values “education”/“no education” to assess the effect of education as a credit purpose. Finally, we handle missing values and normalize the numeric columns in the data.

Easy Interpretation of a Logistic Regression Model with Delta-p

Figure 2. The process from accessing raw credit customer data to training a credit rating model, and to evaluating the effects of predictor columns to the credit rating with Delta-p statistics. This solution was built in KNIME Analytics Platform, and the Assessing Effects of Single Predictors with Delta-p workflow can be inspected and downloaded on the KNIME Hub.

Figure 3 shows the coefficient statistics of the logistic regression model, reproducible in any tool. The “Coeff.” column shows the coefficient values for the different predictor columns, 0.683 for purpose=education. The “P>|z|” column shows the p-values of the coefficients, 0.055 for purpose=education. This means that education as a credit purpose increases the probability of a bad credit rating, since the coefficient value is positive, and this effect is significant at 90 % significance level, since the p-value is smaller than 0.1.

Easy Interpretation of a Logistic Regression Model with Delta-p

Figure 3. Coefficient statistics of a logistic regression model that predicts the credit rating good/bad of a credit applicant

By looking at the coefficient statistics of the logistic regression model, we find out that education as a credit purpose increases the probability of a bad credit rating compared to other credit purposes. In addition, the coefficient value 0.683 tells that the log odds ratio for getting a bad credit rating with/without education as the credit purpose is 0.683, and the odds ratio of the two groups is e0.683=1.979. What would this mean, for example, in a group of 100 credit applicants, let’s say 20 of them with education as the purpose (group 1) and the remaining 80 with another purpose (group 2)? If 10 out of the 80 applicants in the group 2 have a bad credit rating, so their odds is 0.125, then according to the odds ratio 1.979, the odds for the group 1 must be ~2 times the odds of the group 2, so 0.25 in this case. Therefore 5 (a quarter) of the applicants in the group 1 must have a bad credit rating!

The coefficient statistics have a universal scale, and we can use them to compare the magnitude and the effect of different predictor columns. However, to understand the effect of a single predictor, the Delta-p statistics provide an easier way! Let’s take a look:

In Figure 4 you can see the Delta-p statistics and the intermediate results in calculating it, also shown below for the purpose=education variable:

Easy Interpretation of a Logistic Regression Model with Delta-p

Figure 4. Delta-p statistics, its intermediate results, and the corresponding coefficient statistics of a logistic regression model that predicts the credit rating good/bad of a credit applicant

The value 0.159 of the Delta-p statistics indicates that education as a credit purpose increases the probability of a bad credit rating by 15.9 % compared to an average credit application.

If we wanted to compare the effect to the opposite situation, i.e., the credit purpose is not education, instead of an average credit applicant, we would need to recalculate the prior probability and also mean-center the binomial values of the predictor column of interest xi. In our data, 5 % of the people apply the credit for education purposes, so the mean of the “purpose” column xiis 0.05 .

Easy Interpretation of a Logistic Regression Model with Delta-p

The value 0.158 of the Delta-p statistics indicates that the credit applied for education purposes increases the probability of a bad credit rating by 15.8 % compared to those who apply it for other purposes. There’s hardly any difference to the previous situation where we compared against an average applicant and obtained the Delta-p value 0.159 (Figure 4). This means that the credit applicants with other purposes than education are very close to the sample average in terms of their credit rating, apparently because they make up 95% of the total sample.

Now we know that applying credit for education purposes has a negative effect on the credit rating. Which column could have a positive effect? Let’s check the effect of the other dummy column that we created, the “checking” column that tells if the balance of the existing account is negative. The coefficient value of checking=some funds or no account is -1.063 with a p-value 0, as you can see in the first row in Figure 3.

As the Delta-p statistics -0.171 in the first row in Figure 4 show, credit applicants with no negative account balance tend to have a 17.1 % lower probability of a bad credit rating than an average credit applicant. Interestingly, we found two columns, purpose and checking, that have an effect of almost the same size but a different direction. If we look at the odds ratio of these two variables in Figure 4, we wouldn’t get the same information at first glance: The odds ratio is 0.345 for checking=some funds or no account and 1.979 for purpose=education.

Conclusions

In this article, we have introduced Delta-p statistics as a straightforward way of interpreting the coefficients of a logistic regression model. With Delta-p statistics, the predictions based on a logistic regression model are easy to understand by non-technical decision-makers.

We used Delta-p statistics to assess the individual effects that make a credit application succeed or fail. Of course, the use cases of Delta-p statistics are many more. For example, we could use Delta-p statistics to determine the individual touchpoints that decrease or increase the customer satisfaction the most, or to find the symptoms with the highest relevance, when detecting a disease. Also notice that not always the whole process from raw data to model training and model evaluation need to be completed, Delta-p statistics can also be used to re-evaluate the coefficients of a previously trained logistic regression model.

Delta-p statistics can only be used to assess the individual effects of predictor columns in a logistic regression model. Logistic regression might not be the best choice when working with high dimensional data, with many correlated predictor columns, and columns not correlated with the target column. The target classes also need to be linearly separable in the feature space.

If you want to replicate the procedure described in the article, one option is to install the open source KNIME Analytics Platform on their laptops and download the KNIME workflow attached to the article for free. A visual representation of the workflow is available on the KNIME Hub without installing KNIME Analytics Platform. Other options are to implement the calculations in any another programming tool, or even perform them manually with a calculator.

As first published in InfoQ.

Blog
Image
Workflow to assess the effects of single predictors with Delta-p
Image style
Fullwidth
Maarit Widmann &  Alfredo Roccato

Integrated Deployment - Deploying an AutoML Application with Guided Analytics

$
0
0
Integrated Deployment - Deploying an AutoML Application with Guided AnalyticspaolotamagMon, 10/05/2020 - 10:00

Introduction

Welcome to our collection of articles on the topic of Integrated Deployment, where we focus on solving the challenges around productionizing data science. So far, in this collection we have introduced the topic of Integrated Deployment, discussed the topics of Continuous Deployment and Automated Machine Learning, and presented the AutoML Verified Component

In today’s article we would like to look more closely at how Verified Components are used in Integrated Deployment based on the example of our AutoML component. This article is designed for the data scientist, showing how to build an application a business user will be able to use without needing to know how to use KNIME Software.

In particular we will examine how the AutoML component was built into a workflow based on the principles of Guided Analytics and how - in combination with the KNIME WebPortal - business users can be guided through the autoML process, enabling them to control it via their web browser and a user friendly interface. This is where the real potential of autoML lies: allowing the business user to concentrate fully on providing their expert input and not worry about the complexity of the underlying processes.

Guided Analytics: building an interactive interface for the business user

This is what Guided Analytics and KNIME WebPortal are all about: smoothly guiding the user through a sequence of interactive views, exposing only those settings that are really needed and hiding unnecessary complexity. Guided Analytics can be easily applied to any KNIME workflow, and of course to our AutoML component, too. 

Building such an interactive interface can be done in a myriad of variants, but let’s assume instead a very simple guided analytics autoML example. In our example, we have the following sequence of user interactions:

  1. Data Upload: the user provides the data in a simple CSV file.
  2. AutoML Settings: a few controls for the user to decide what should be automatically trained.
  3. Results and Best Model Download: a summary of the output of the AutoML process with an option to quickly export the model.
  4. Deployment of the Model: the workflow produced by the AutoML component can be deployed on KNIME Server if the user decided to do so.

How do you build this sequence of of four interactive views controlling the AutoML component in a KNIME workflow? Well, with more components! One component for each interactive view. Those additional components contain Widget and JavaScript nodes which are rendered as different visual elements in each component’s Composite View.

The data scientist can set up just the right amount of interaction for anyone else in the company directly from KNIME Analytics Platform. The resulting example KNIME workflow (Fig. 1), AutoML Component via Interactive Views, which we created, is publicly available on KNIME Hub and can be downloaded and tested with KNIME Analytics Platform. 

Note:Before Integrated Deployment we used the term Guided Automation to refer to Guided Analytics in an AutoML application. This term is still relevant but also linked to a much more complex workflow, which we don't cover here, yet.

Integrated Deployment - Deploying an AutoML Application with Guided Analytics

Figure 1: The Guided Analytics Workflow for the AutoML Component. 

Our Guided Analytics workflow for the AutoML component is a simple example that shows how the AutoML process can be controlled via interactive views. The workflow produces four interactive views which result in a Guided Analytics application.

If the workflow is downloaded from the KNIME Hub and deployed to a KNIME Server, you can use it to automatically to train machine learning models and you do not need to know KNIME to do so. It can be executed directly via a web browser via KNIME WebPortal (Fig. 2).

Note: The workflow can also be run on the open source KNIME Analytics Platform with example datasets and without the deployment aspect. (Right click any component and click "Open Interactive View".)

Integrated Deployment - Deploying an AutoML Application with Guided Analytics

Figure 2: The Guided Analytics Application using the AutoML Component. The animation shows the interactions of the user accessing the KNIME WebPortal from a web browser and running the application from data access to deployment of the final model. The KNIME workflow behind the application is totally hidden from the eye of the user, operating the guided analytics application step bystep. 

How does the guided analytics application work?

Let’s dive now a bit more into how the guided analytics application works (Fig. 3). The first Custom View “Data Access View” (in orange - Fig. 3) generates an interface to customly load the data into the KNIME workflow (in yellow - Fig. 3). In KNIME this can be done in countless ways depending on your organization setup.

In our example the default behaviour is to load data from a simple SQL database, if credentials are provided. The data is cached in a CSV file updated each time the workflow is executed. If the user manually uploads a new CSV file this would replace the SQL query. 

Once a dataset is provided, the user moves to the second Custom View “AutoML Setting ” (in light green - Fig. 3). At this point the KNIME WebPortal business user can interact, totally unaware of the connected Widget nodes, and define the target column, filter the input feature column, add which machine learning algorithm should be applied as well as select the performance metric to be used. Once the input from the WebPortal user is provided, the AutoML Component executes on KNIME Server using all the necessary computational power.

The last Custom View “Results and Model Download” (in red - Fig. 3) shows the best model - automatically selected based on the performance metric provided by the business user, also providing information about all the other models’ performances listed in a bar chart.

The best model deployment workflow can now be downloaded and opened in KNIME Analytics Platform and/or deployed to KNIME Server. In figure 3, you can see the full KNIME WebPortal User Journey (in blue) which the guided analytics application guides the business user through. At any point the business user can go back and try something different to see how the results change, no need to code R or Python or drag and drop a single KNIME node: the business user simply interacts with the views moving through the process using the “Next” and “Back” buttons.

Integrated Deployment - Deploying an AutoML Application with Guided Analytics

Figure 3: The diagram linking the Workflow behind the UI of the Guided Analytics application.The workflow offers three components which in sequence produce the three views of the Guided Analytics application: “Data Access” (in orange), then “AutoML Settings” (in light green), and finally “Results” (in red). In between the “Settings View” and “Results View” components the AutoML (Verified Component) takes care of training the desired models. Additionally the inside of the “Settings View” is shown in the bottom right corner, showing how easily such an interface can be customized by a data scientist.

Data partitioning to train and validate

Another important aspect of the workflow is how the data is partitioned. The AutoML component itself partitions the data into the train and validation set. On the outside however the “Settings View” Component creates an additional test set partition. The final “Results View” Component scores the output model via a Workflow Executor node and measures its performance again and displays it to the business user on the KNIME WebPortal. This practice (Fig. 4) is quite powerful as the user can witness right away if there is a huge drop between the performance reported by the AutoML Component on the validation set and the performance reported by this final evaluation on the test set. If there is a big difference it might mean the model is somehow overfitting the validation partition.

Integrated Deployment - Deploying an AutoML Application with Guided Analytics

Figure 4: The diagram explaining how the data partitioning takes place in the AutoML process. That data is partitioned first by the workflow and only afterwards by the AutoML Component. This leads to three data partitions: the Train Data to train the models and with optimized parameters via cross validation; the Validation Data to evaluate all models and compare them; the Test Data to measure the performance of the best model before its optional deployment.

Wrapping up

In this article, we have explained how to build a guided analytics application around the AutoML Component to give the business user an easy process to automatically train machine learning models. Our example was a simple example. For a more detailed blueprint, check the workflow Guided Automation also available on the KNIME Hub. The Guided Automation workflow group additionally covers: Feature Engineering, Feature Selection, Customizable Parameter Optimization, Distributed Execution and a bit of Machine Learning Interpretability / XAI.

Stay tuned for more articles on Integrated Deployment and all the new data science practices this extension enables!

Image
Integrated Deployment - Deploying an AutoML Application with Guided Analytics
Image style
Fullwidth
Paolo Tamagnini

An Introduction to Reinforcement Learning

$
0
0
An Introduction to Reinforcement LearningCoreyMon, 10/12/2020 - 10:00

Teaching KNIME to Play Tic-Tac-Toe

In this blog post I'd like to introduce some basic concepts of reinforcement learning, some important terminology, and a simple use case where I create a game playing AI in KNIME Analytics Platform. After reading this, I hope you’ll have a better understanding of the usefulness of reinforcement learning, as well as some key vocabulary to facilitate learning more.

Contents

Reinforcement Learning and How It’s Used

You may have heard of Reinforcement Learning (RL) being used to train robots to walk or gently pick up objects; or perhaps you may have heard of Deep Mind’s AlphaGo Zero AI, which is considered by some to be the best Go “player” in the world. Or perhaps you haven’t heard of any of that. So we’ll start from the beginning.

Reinforcement learning is an area of Machine Learning and has become a broad field of study with many different algorithmic frameworks. Summarized briefly, it is the attempt to build an agent that is capable of interpreting its environment and taking an action to maximize its reward. 

At first glance this sounds similar to supervised learning, where you seek to maximize a reward or minimize a loss as well. The key difference is that those rewards or losses are not obtained from labeled data points but from direct interaction with an environment, be it reality or simulation. This agent can be composed of a machine learning model - either entirely, partially, or not at all. 

An Introduction to Reinforcement Learning

Fig 1:  Reinforcement Learning cycle wherein the agent recursively interacts with its environment and learns by associating rewards with its actions. Source: https://commons.wikimedia.org/wiki/File:Reinforcement_learning_diagram.svg

A simple example of an agent that contains no machine learning model is a dictionary or a look-up table. Imagine you’re playing “Rock-Paper-Scissors” against an agent that can see your hand before it makes its move. It’s fairly straightforward to build this look up table, as there are only three possible game states for the agent to encounter. :

An Introduction to Reinforcement Learning

Fig. 2: Look-up table instructing a Rock-Paper-Scissors agent on which move to take based on its opponent's move.

This can get out of hand very quickly, however. Even a very simple game such as Tic-Tac-Toe has nearly 10 million possible board states. A simple look-up table would never be practical, and let’s not even talk about the number of board states in games like Chess or Go.

This is where machine learning comes into the equation

Through different modeling techniques, commonly Neural Networks, thanks to their iterative training algorithm, an agent can learn to make decisions based on environment states it has never seen before.

While it is true that Tic-Tac-Toe has many possible board states and a look-up table is impractical, it would still be possible to build an optimal agent with a few simple IF statements. I use the Tic-Tac-Toe example anyway, because of its simple environment and well known rules.

Real world applications of reinforcement learning

When talking about Reinforcement Learning the first question is usually what’s that good for? The examples above are very far removed from most practical use cases, however I do want to highlight a few real world applications in the hopes of inspiring your imagination.

  • Chemical Drug Discovery
    • Reinforcement Learning is often used to create chemical formulas/compounds with a desired set of physical properties, according to the following sequence of actions: Generate compound > test properties > update model > repeat.
  • Bayesian Optimization
    • Included in the KNIME Parameter Optimization Loop, this strategy iteratively explores the parameter space and updates a distribution function to make future selection decisions. 
  • Traffic Light Control
    • Reinforcement Learning has made huge strides here as well. However, in this case, the partially observable nature of real world traffic adds some layers of complexity. 
  • Robotics
    • This is likely the most famous of these use cases. In particular we’ve seen many examples of robots learning to walk, pick up objects, or shake hands in recent years.

Even if none of these use cases hits close to home for you, it’s always important that a data scientist continually adds new tools to his belt, and hopefully it’s an interesting topic besides. 

Adding Formality

Let’s now lay out a more concise framework.

An Introduction to Reinforcement Learning

Fig. 3: Reference table for notation used in description of Reinforcement Learning process.

Basic Reinforcement Learning is described as a Markov Decision Process. This is a stochastic system where the probability of different outcomes are based on a chosen Action, a, and the current Environment State, s. Specifically this outcome is a New Environment State that we’ll denote s’. 

Let’s define two functions on top of these terms as well: Ra(s,s’) and Pa(s,s’). Ra(s,s’) denotes the reward assigned when moving from state s to state s’, and Pa(s,s’) the probability of moving from state s to s’, given action a.

So we’ve defined the system, but we’re still missing one part. How do we choose the Action we should take at State s? This is determined by something called a Policy Function denoted as ℼ(s). Some simple examples of a Policy Function might be:

  • ℼ(s) = move up
    • when navigating a grid
  • ℼ(s) = hit me
    • when playing blackjack
  • ℼ(s) = a; where a is a random element of A
    • when using a Machine Learning model for ℼ(s) we may start from this point to gain a varied data set for future trainings

A Policy Function could be much more complicated as well. Such as a huge set of nested IF statements… but let's not go there.

What we’ve done so far 

  1. Determine action to take at the current State s
    • a = ℼ(s)
  2. Determine New State s’
    • This new state is often stochastic, based on Pa(s,s’)
  3. Determine the Reward to be assigned to action a
    • Reward is based on some function Ra(s,s’) depending on the chosen action a. For example, there is some intrinsic reward if I get to work in the morning, but far less if I chose to charter a helicopter to take me there… 

Choosing a Policy Function

Let’s talk more about the Policy Function ℼ(s). There is a myriad of options for ℼ(s), when using machine learning, but for the sake of this article I want to introduce one simple example: An agent I’ve built to play Tic-Tac-Toe.

An Introduction to Reinforcement Learning

Fig 4: Playing a Tic-Tac-Toe game against a reinforcement learning trained AI.

I mentioned above that for Tic-Tac-Toe there are far too many board states to allow for a look-up table. However at any given State, s, there are never more than nine possible Actions, a. We’ll denote more concisely these possible actions at state s as As, contained in A. If we knew what the reward would be for each of these possible actions, we could define our Policy Function to produce the action with the highest reward, that is:

ℼ(s) = a | Maxa∈As Ra(s, s’)

Reward function

Among the many possible reward functions, we can choose to quantify how close to winning - or losing - the move brought the Agent. Something like:

Ra(s,s’) = 0.5 + [# of Moves played so far] / 2*[# of Moves in game] if Agent wins

0.5 - [# of Moves played so far] / 2*[# of Moves in game] if Agent loses

However, this reward function is undetermined until the game is over and the winner becomes known. This is where we can apply machine learning: We can train a predictive model to estimate our reward function, implicitly predicting how close this move will take the agent to win. In particular, we can train a neural network to predict the reward given some action. Let's denote this as:

NN(a) ~ Ra(s,s’)

An Introduction to Reinforcement Learning

Neural network training - supervised learning

At this point, the problem has moved to the training of a neural network, which is a supervised learning problem. For that, we need a training set of labeled data, which we can collect by simply letting our network play the game. After every game has been played, we score all the actions, through the original Reward Function Ra(s,s’). On these scores on the actions in all played games, we then train a neural network to predict the reward value - NN(a) - for each action in the middle of the game.

The network is trained multiple times on a new training set including the latest labeled games and actions. Now, it does take a lot of data to effectively train a neural network, or at least more than we’d get from just one or two games. So how can we collect enough data? 

An Introduction to Reinforcement Learning

As a final, theoretical hurdle, it should be noted that neural networks are, typically, deterministic models and, if left to their own devices, will always make the same predictions given the same inputs. So, if we leave the agent to play against itself, we might get a series of identical games. This is bad, because we want a diverse set of data for training. Our model won’t learn much, if it always plays the exact same game move after move. We need to force the network to “Explore” more of the move space. There are certainly many ways to accomplish this and one is to alter the policy function at training time. Now instead of being:

ℼ(s) = a | Maxa∈As NN(a)

It becomes the following, which enables the agent to explore and learn:

ℼ(s) = a | Maxa∈As NN(a) with probability 0.5

= a ∈ As with probability 0.5

A common approach is to alter the above probabilities dynamically, typically decreasing them over time. For simplicity I’ve left this as a constant 50/50 split.

Implementation

Now for the implementation! We need to build two applications: one to train the agent and one to play against the agent.

Let’s start with building the first application, the one that collects the data from user-agent games as well as from agent-agent games, labels them by calculating the score for each action, and uses them to train the neural network to model the reward functions. That is, we need an application that:

  • Defines the neural network architecture
  • Implements the reward function Ra(s,s’), as defined in the previous section, to score the actions
  • Implements the latest adopted policy function ℼ(s)
  • Lets the agent play against a user and saves the actions and result of the game
  • Lets the agent play against itself and saves the actions and result of the game
  • Scores the actions
  • Trains the network

For the implementation of this application we used KNIME Analytics Platform, because it is based on a Graphical User Interface (GUI) and it is easy to use. KNIME Analytics Platform extends its user-friendly GUI also to the Deep Learning Keras integration. Keras libraries are available as nodes and can be implemented with a simple drag & drop.

The network architecture

In the workflow in Fig. 5, the brown nodes, the Keras nodes, at the very top build the neural network architecture, layer after layer. 

  • The input layer receives a tensor of shape [27] as input, where 27 is the size of the board state. The current state of the board is embedded as a one-hot vector of size 27.
  • The output layer produces a tensor of shape [1] as the reward value for the current action. 
  • The middle 2 hidden layers, with 54 units each, build the fully connected feedforward network used for this task. These 2 layers have a dropout function, with a 10% rate, applied to help counter overfitting as the model continues to learn.
An Introduction to Reinforcement Learning

Fig 5: KNIME workflow for training the Agent using Reinforcement Learning on a Keras Model.

Implementing the game sessions

In the core of the workflow you see three nested loops. A recursive loop inside a counting loop inside an active learning loop. These represent, from inside to outside, the play of an individual game (the recursive loop), the play of a set of games (the counting loop), and the play of many sets of games in between training sessions of the network (the active learning loop).

The recursive loop continually allows the network to make moves on the game board, from alternating sides, until an end condition is met. This condition being: three marks in a row, column, or diagonal required to win a game of Tic-Tac-Toe, or if the board is filled completely in the event of a draw.

The counting loop then records the different game states, as well as how close they were to either winning or losing, and repeats the process 100 times. This will produce 100 games worth of board states we will use to train the Network before repeating the process.

The active learning loop collects the game sessions and the board states from each game, assigns the reward score to each action, as implemented in the Math Formula node, and feeds the Keras Network Learner node to update the network with the labeled data, tests the network, and then waits till the next batch of data is ready for labeling and training. Note that the testing is not required for the learning process but is a way to observe the models progress over time.

The active learning loop is a special kind of loop. It allows us to actively obtain new data from a user and label them for further training of machine learning models. Reinforcement Learning can be seen as a specific case of Active Learning, since here data also have to be collected through interactions with the environment. Note that it is the recursive use of the model port in the loop structure that allows us to continually update the Keras model.

Agent-agent game sessions

In this workflow, the agent plays against itself a configured number of times. By default the network plays 25 sets of 100 games for a total of 2,500 games. This is the Easy Mode AI available in the KNIME WebPortal. The Hard Mode AI was allowed to play an additional 100 sets of 100 games a total of 12,500 games. To further improve the AI we could tune the network architecture or play with different reward functions.

The game as a web application

The second application we need is a web application. From a web browser, a user should be able to play against the agent. To deploy the game on a web browser we use the KNIME WebPortal, a feature of the KNIME Server.

In KNIME Analytics Platform, JavaScript-based nodes for data visualization can build parts of web pages. Encapsulating such JavaScript-based nodes into components allows the construction of dashboards as web pages with fully connected and interactive plots and charts. In particular, we used the Tile View node to display each of the nine sections of the Tic-Tac-Toe board, and show a blank, human, or KNIME icon on each.

The deployment workflow that allows a human to play (and further train) the agent is shown in Fig. 6. A game session on the resulting web-application is shown in Fig. 7.

An Introduction to Reinforcement Learning

Fig 6: KNIME workflow for creating the playable webportal application seen below. 

An Introduction to Reinforcement Learning

Fig 7: Playing against the AI on Easy on the KNIME Server Webportal

An Introduction to Reinforcement Learning

Fig 8:  Playing against the AI on Hard on the KNIME WebPortal

This example of both the learning and playing workflows is available for you to download, play with, and modify on the KNIME Hub! I’m curious to see what improvements and use case adaptations you might come with!

Download these workflows from the KNIME Hub here:

Conclusions

In summary, we introduced a few popular use cases for Reinforcement Learning: Drug Discovery, Traffic Regulation, and Game AI. On that topic I definitely encourage you to take to google and see the many other examples.

We introduced a simple Reinforcement Learning strategy based on the Markov Decision Process and detailed some key notation that will help you in your own research.

Finally we covered how a simple example can be implemented in KNIME Analytics Platform. I hope I’ve inspired you to explore some of the links included in the further reading section below. The MIT Press book on Reinforcement Learning is particularly popular and happy reading!

Further Reading and References

Blog
Image style
Fullwidth
Corey Weisinger

Solving a Kaggle Challenge using the combined power of KNIME Analytics Platform & H2O

$
0
0
Solving a Kaggle Challenge using the combined power of KNIME Analytics Platform & H2OMarten_Pfannen…Wed, 10/14/2020 - 14:04

Demand Prediction Challenges

Some time ago, we set our mind to solving a popular Kaggle challenge offered by a Japanese restaurant chain and predict how many future visitors a restaurant will receive.

Making forecasts can be a tricky business because there are so many unpredictable factors that can affect the equation; demand prediction is often based on historical data, so what happens when those data change dramatically? Will the model you are using to produce your prediction still work when the data in the real world experience change - a slow drift or a sudden jump? Who would have thought at the beginning of 2020 that restaurants around the world would soon be going into lockdown and having to come up with creative solutions to sell their products? The impact of this pandemic has brought many challenges to demand prediction because the data we are collecting now is so different to what it was before.

The data we are using to solve this Kaggle Challenge was collected during 2016 to April 2017 - so we would like to point out that it does not reflect the dramatic changes in restaurant attendances we have seen since the onset of the coronavirus pandemic.

In previous blog articles we have looked at classic demand prediction problems, for example predicting future electricity usage to shield electricity companies from power shortages or power surpluses. In this article we want to take a mixed approach to predicting how many future visitors will go out for a meal to a restaurant and also take advantage of the open architecture of KNIME Analytics Platform to bring an additional tool into the mix.

Note: We developed a cross-platform ensemble model to predict flight delays (another popular challenge). Here, cross-platform means that we trained a model with KNIME, a model with Python, and a model with R. These models from different platforms were then blended together as an ensemble model in a KNIME workflow. Indeed, one of KNIME Analytics Platform’s many qualities consists of its capability to blend data sources, data, models, and, yes, also tools.

Cross-platform solution with KNIME Analytics Platform and H2O

For this restaurant demand prediction challenge we decided to develop a cross-platform solution using the combined power of KNIME Analytics Platform and H2O.

The article is split into two sections - one looks at the KNIME H2O extensions and give you information on how to instasll them. The second section is dedicated to the actual Kaggle Challenge.

Content

The KNIME H2O Extensions

The integration of H2O in KNIME offers an extensive number of nodes and encapsulating functionalities of the H2O open source machine learning libraries, making it easy to use H2O algorithms from a KNIME workflow without touching any code - each of the H2O nodes looks and feels just like a normal KNIME node - and the workflow reaches out to the high performance libraries of H2O during execution.

There is now a new commercial offering, which joins H2O Driverless AI and KNIME Server. If this interests you, you can find more information about that here and see an example workflow on the KNIME Hub. Visit https://www.knime.com/partners/h2o-partnership.

To use H2O within KNIME Analytics Platform, all you need to do is install the relevant H2O extension and you’re ready to go. At the time of writing there are essentially two different types H2O extensions for KNIME - one type caters to big data and the other is for machine learning.

Kaggle Challenge Demand Prediction KNIME and H2O

Figure 1. The KNIME H2O Extensions on the KNIME Hub.

Install the KNIME H2O Machine Learning Integration extension

With your installation of KNIME Analytics Platform open, go to the KNIME Hub and click the H2O extension you want to use. Next, simply drag the extension icon into the Workflow Editor. And that’s it!

Fig. 2 The KNIME HJ2O Machine Learning Integration on the KNIME Hub - click the icon marked in green and drag and drop it to your KNIME Workflow Editor to install it.

The Kaggle Demand Prediction Challenge

Eight different datasets are available in this Kaggle challenge. Three of the datasets come from the so-called AirREGI (air) system, a reservation control and cash register system. Two datasets are from Hot Pepper Gourmet (hpg), which is another reservation system. A further dataset contains the store IDs from the air and the hpg systems, which allows you to join the data together, and another provides basic information about the calendar dates. At first I wondered what this might be good for, but the fact that it flags public holidays came in quite handy.

Last but not least there is a file that contains instructions for the work submission. Here, you must specify the dates and stores for your model predictions. More information on the datasets can be found at the challenge web page.

Combining the power of KNIME and H2O in a single workflow

To solve the challenge, we implemented a classic best model selection framework according to the following steps:

  1. Data preparation, i.e. reading, cleaning, joining data, and feature creation all with native KNIME nodes
  2. Creation of a local H2O context and transformation of a KNIME data table into an H2O frame
  3. Training of three different H2O based Machine Learning models (Random Forest, Gradient Boosted Machine, Generalized Linear Models). Training procedure also includes cross-validation and parameter optimization loops, by mixing and matching native KNIME nodes and KNIME H2O extension nodes.
  4. Selection of the best model in terms of RMSLE (Root Mean Squared Logarithmic Error) as required by the Kaggle Challenge.
  5. Deployment, i.e. converting the best model into an H2O MOJO (Model ObJect Optimized) object and running it on the test data to produce the predictions to submit to the Kaggle competition.

Fig. 3. The KNIME workflow, Customer Prediction with H2O, implemented as a solution to the Kaggle restaurant competition. Notice the mix of native KNIME nodes and KNIME H2O extension nodes. The KNIME H2O Machine Learning Integration extension nodes encapsulate functionalities from the H2O library.

Let’s now take a look at these steps one by one.

Data Preparation

The workflow starts by reading seven of the datasets available on the Kaggle challenge page.

The metanode named “Data preparation” includes flagging weekend days vs. business days; joining reservation items; aggregating (mean, max, and min) on groups of visitors, as by restaurant genre and/or geographical area.

The dataset contains a column indicating the number of visitors for a particular restaurant on a given day. This value will be used as the target variable to train the predictive models later on in the workflow. At the end of the data preparation phase, the dataset is then split in two parts: one part with the rows with a non-missing value for the field “number of visitors” and one part containing the remaining records with missing number of visitors. The last dataset represents the test set upon which the predictions will be calculated to submit to the Kaggle competition.

Fig. 4. This is the sub-workflow contained in the “Data preparation” metanode. It implements weekend vs. business day flagging, data blending via joining, as well as a few aggregations by restaurant group.

As you can see from the screenshot in Figure 4, the data processing part was implemented solely with native KNIME nodes, so as to have a nicely blended, feature enriched dataset in the end.

Creation of Local H2O Context

To be able to use the H2O functionalities, you need to start an H2O environment. The H2O Local Context node does the job for you. Once you’ve created the H2O context, you can convert data from your KNIME data tables into H2O frames and train H2O models on these data.

Training Three Models

As the prediction problem was a regression task, I chose to train the following H2O models: Random Forest, Generalized Linear Model, and Gradient Boosting Machine algorithm.

The H2O models were trained and optimized inside the corresponding metanodes in Figure 1. Let’s take a look for example at the metanode named “Gradient Boosting Machine” (Fig. 4). Inside the metanode you’ll see the classic Learner-Predictor motif, but this time the two nodes rely on H2O based code. The “Scoring (RMSLE)” metanode calculates the error measure. We repeat this operation five times using a cross-validation framework.

The cross-validation framework is interesting. It starts with an H2O node - H2O Cross-Validation Loop Start node - and it ends with a native KNIME Loop End node. The H2O Cross-Validation Loop Start node implements the H2O cross-validation procedure extracting a random different validation subset at each iteration. The Loop End node collects the error measure from each cross-validation result. The two nodes blend seamlessly, even though they refer to two different analytics platforms.

On top of all that, an optimization loop finds the optimal parameters of the specific model for the smallest RMSLE average error. This loop here is completely controlled via native KNIME nodes. The best parameters are selected via the Element Selector node and the model is trained again on all training data with the optimal parameters.

As you can see, the mix and match of native KNIME nodes and H2O functionalities is not only possible, but actually quite easy and efficient.

Fig. 5. Content of the “Gradient Boosting Machine” metanode , including model training and model prediction, cross-validation loop, and optimization loop. Notice the H2O Cross-validation Loop Start node blends seamlessly with the native KNIME Loop End node.

Selecting the Best Model

As a result of the previous step I have a table with three different models with their respective RMSLE scores, as this is the metric used by Kaggle to compute the leaderboard. RSMLE was likely chosen over root mean squared error due to its robustness to outliers and the fact that it penalizes underestimations stronger than overestimations, i.e. by optimizing your model for RMSLE you rather plan with more customers than actually visiting your restaurant.

Fig. 6. Bar chart comparing scores of the three different models. Y-axis shows the model names and x-axis shows their score in RMSLE.

From the chart one can easily see that Random Forest and Gradient Boosting Machine outperformed Generalized Linear Model in this case. Random Forest and GBM almost end up in a tie, GBM only having a slightly lower RMSLE. Our workflow automatically selects the model that scored best with the Element Selector node, in the metanode named “Select best model”.

Afterwards the model is transformed into an H2O MOJO (Model ObJect, Optimized) object. This step is necessary in order to use an H2O model outside of an H2O context and to use the general H2O MOJO Predictor node.

Predictions to Kaggle

Remember that the blended dataset was split in two partitions? The second partition, without the number of visitors, is the submission dataset. The MOJO model that was just created is applied to the submission dataset. The submission dataset, this time with predictions, is then transformed into the required Kaggle format and sent to Kaggle for evaluation.

Conclusions

We did it! We built a workflow to solve the Kaggle challenge.

The workflow blended native KNIME nodes and KNIME H2O Extension nodes, thus combining the power of KNIME Analytics Platform and H2O under the same roof.

The mix and match operation was the easiest part of this whole project. Indeed, both the KNIME and H2O open source platforms have proven to work well together, complementing each other nicely.

We built this workflow not with the idea of winning (the submission deadline was over before we even got our hands on this anyway), but to showcase the openness of KNIME Analytics Platform and how easily and seamlessly the KNIME H2O extension integrates H2O in a KNIME workflow. The workflow indeed can still be improved, maybe with additional machine learning models - that would potentially be able to cope with factors such as the change in data that we are experiencing due to the COVID-19 pandemic - with more sophisticated feature engineering, or with the adoption of an ensemble model rather than of the best selected model.

How did we score?

Well now, would you like to know how we scored on Kaggle? Our submission had a RMSLE of 0.515, which puts it in the top 3% of more than 2000 submissions. Considering that we spent just a few days on this project, we are quite satisfied with this result.

Blog
Marten Pfannenschmidt

Combining the power of KNIME and H2O.ai in a single integrated workflow

$
0
0
Combining the power of KNIME and H2O.ai in a single integrated workflowadminWed, 10/14/2020 - 20:00

Expanding Partnership by adding KNIME H2O Driverless AI support

Today, we’d like to look at how customers of both H2O.ai and KNIME can benefit from a new integration that enables H2O Driverless AI to be used in KNIME. KNIME users can leverage Driverless AI in a workflow to provide automatic feature engineering, model validation, model tuning, model selection, machine learning interpretability, time-series, NLP, computer vision, and automatic pipeline generation for model scoring. H2O Driverless AI provides companies with a data science platform that addresses the needs of various use cases for every enterprise in every industry. 

    We have just announced that we have expanded our partnership and collaboration. The new partnership means that you can now seamlessly use H2O Driverless AI in KNIME via a new KNIME Driverless AI extension available from the KNIME Hub. “The integration of Driverless AI offers KNIME users a strong, additional option to automate machine learning out of the box with a huge range of powerful algorithms. We believe that flexibility of choice brings most value to our users and customers, and H2O is a great addition to the mix.” Michael Berthold, CEO, and co-founder of KNIME.

    The aim of this article is to provide you more details about the integration, how to get started, how various personas can leverage this integration, access to a sample workflow, and pointers to further resources.

    Content

    Early Adopter Feedback

    We have been working with a few early adopters to get their feedback. The response has been overwhelmingly positive and a feeling of excitement about the integration and productivity gains. Vision Banco has been a long term user of H2O.ai and KNIME. The data science team is looking forward to the improved simplification and even more rapid development of data science projects. Below is a quote by Alejandro Lopes, the Data Science Leader at Vision Banco on how he thinks it will help them:

    We have been using KNIME and H2O Driverless AI for years, and we are very excited about this new integration and the automation and simplification that it will bring to our data science workflow.” Alejandro Lopez, Data Science Leader of Vision Banco

    New to KNIME?

    Learn more from the KNIME product page.

    Combining the power of KNIME and H2O.ai in a single workflow

    Fig. 1 Overview of KNIME Software

    New to H2O Driverless AI?

    Explore the product page or tutorials.

    Combining the power of KNIME and H2O.ai in a single workflow

    The KNIME H2O Driverless AI Extension

    In order to use H2O Driverless AI within KNIME Analytics Platform, all you need to do is install the H2O Driverless AI extension, and you’re ready to go. Check this video, if you do not know how to install a KNIME extension.

    The integration of H2O Driverless AI in KNIME offers an extensive number of nodes and encapsulating functionalities of the H2O Driverless AI automatic machine learning (AutoML) platform, making it easy to use H2O Driverless AI autoML capabilities from a KNIME workflow without touching any code - each of the H2O Driverless AI nodes looks and feels just like a normal KNIME node - but the workflow reaches out to the high-performance libraries of H2O during execution.

    Combining the power of KNIME and H2O.ai in a single workflow

    Fig. 2 The H2O Driverless AI nodes in KNIME

    Use Cases By Persona

    This new integration between H2O Driverless AI and KNIME helps various personas in the data science life cycle. Below will provide a short overview of key personas and how this new integration improves the workflow and productivity.

    Data Engineers

    For Data Engineers, this solution enables seamless data preprocessing connected into DriverlessAI using the popular, easy to use, and free KNIME Analytics Platform. You can also use KNIME Server to provide additional deployment capabilities, automation, collaboration, cloud execution, and IT administration. With the new KNIME to H2O.ai connectors, customers can do data blending with hundreds of data sources, including Salesforce, Sharepoint, Oracle, SAP, SAP Hana, Snowflake, Spark, DataBricks, Hadoop, Tibco, Tableau, PowerBI, AWS, Azure, and GCP.

    Data Scientists

    For data scientists and model operation teams, this solution provides additional flexibility by enabling a mix and match of automated and custom machine learning approaches. Data scientists can now collaborate with business stakeholders, gaining valuable input to achieve the optimal result. Upon initial model creation, they can ensure that it is streamlined using Integrated Deployment from KNIME and the Driverless AI AutoML and MOJO deployment artifacts. The addition of Driverless AI natively within a KNIME workflow now provides data scientists an integrated visual drag and drop ability to create such a pipeline. Data Scientists can now leverage the industry-leading AutoML in Driverless AI to quickly train high quality and explainable models that are production-ready in less time.

    Deployment Teams

    For Deployment Teams, there is now additional flexibility in how and where the H2O Driverless AI trained models are automatically deployed as workflows, from visualization to being deployed as RESTful services, to web applications, to BI dashboards, to 3rd party tools, and all with a no-code approach. Teams will now be able to automatically and continuously deploy and update models including automated data access, preparation, and pre-processing of workflows, ensuring that there is no loss in translation between the creation and deployment of the model and that ideal compute resources are utilized for ongoing deployment.

    Data Science Team Leaders

    For Leaders of Data Science teams, this solution enables you to make the best use of your people, time, and technology resources in order to meet the needs of both the team and the enterprise. It provides an environment which empowers your data science team to use best in class AutoML with other best in class approaches and to collaborate on complex projects with the granular permissions and logging needed for team and project management. Productionize data science applications and services in a way that is transparent, secure, and able to be audited and governed as needed. The deployment and management functionalities make it easy to productionize data science applications and services and deliver usable, reliable, and reproducible insights for the business.

    Line of Business Leaders

    This solution provides Line of Business Leaders to have insight into the entire process and data lineage so that you can understand how and why decisions are made from data access to deployment and bring your domain expertise to bear in the process. This allows you to mitigate risks and ensure the best results are delivered quickly and at scale to drive the desired business outcome.

    Four Steps to Getting Started

    The 4 steps to get started with the KNIME Analytics Platform and H2O Driverless AI integration are:

    1. Get the tools
    2. Get KNIME Extension
    3. Configure KNIME to connect to H2O Driverless AI server
    4. Start Building your workflow

    Below we will provide a quick overview of each step.

    1. Get the tools

    If you are interested in trying the Driverless AI integration with KNIME Server please email partners@knime.com.

    2. Get the H2O Driverless AI KNIME Extension

    Download and Install Driverless AI KNIME Extension from the KNIME Hub, by dragging and dropping the extension directly to your installation of KNIME Analytics Platform.

    Combining the power of KNIME and H2O.ai in a single workflow

    Fig. 3. Installling the H2O Driverless AI extension from the KNIME Hub.

    3. Configure KNIME to connect to H2O Driverless AI

    You are almost ready to start, now you just need to enter the Driverless AI license key and configure KNIME to connect to H2O Driverless AI. Follow these instructions.

    Combining the power of KNIME and H2O.ai in a single workflow

    Fig. 4 Configuring KNIME to connect to H2O Driverless AI.

    4. Start Building your workflow

    Once you have successfully installed the Driverless AI Extension, restart KNIME Analytics Platform and you should see the following nodes in the node repository under KNIME Labs:

    Combining the power of KNIME and H2O.ai in a single workflow

    Fig. 5 The H2O Driverless AI nodes in the Node Repository.

    Get an overview of how to starting building your flow below and follow the KNIME H2O Driverless AI Integration User Guide

    Combining the Power of KNIME and H2O in a Single Workflow Example

    In this section, we will walk through an example of the major steps of an end-to-end data science workflow using KNIME Analytics Platform and Driverless AI.

    Step 1: Import the Driverless AI license

    In order to utilize the H2O Driverless Al nodes, you will need to import an H2O Driverless Al license file into your KNIME preferences.

    • You will find the Driverless AI license key typically under the following path:
      • /opt/h2oai/dai/home/.driverlessai/license.sig
    • Copy this file to where your KNIME Analytics Platform is installed.
    • Import this file into KNIME by navigating to File -> Preferences -> KNIME-> H2O Driverless Al and, as shown in Figure 6.
    • Now upload the .sig file provided by H2O.ai.
    Combining the power of KNIME and H2O.ai in a single workflow

    Fig. 6: Upload Driverless AI license to KNIME

    Step 2: Importing Data

    KNIME supports a wide array of data types. From flat files to dynamic Spark connections, KNIME can make it simple to read disparate data types and make them work together for use in machine learning algorithms. In the example below, joining a CSV file, two database tables, and a KNIME table is a simple drag and drop process. 

    Combining the power of KNIME and H2O.ai in a single workflow

    Fig. 7 Joining a CSV file, two database tables and a KNIME table is a simple drag-and-drop process.

    Step 3: Data Preparation

    KNIME provides a rich set of data source connectors and data preparation nodes with a no-code drag and drop canvas to simplify data access and preparation. This empowers data analysts, data engineers and data scientists to quickly build data preparations flows to prepare, wrangle, clean, join and filter the data and get it ready for machine learning. Once the data is prepared it can be connected to Driverless AI to build the machine learning models within the same drag and drop canvas.

    Combining the power of KNIME and H2O.ai in a single workflow

    Fig. 8 Data source connectors and data preparation nodes are connected via a no-code drag and drop canvas to simplify data access and preparation.

    Step 4: Building Models with Driverless AI

    In order to send KNIME data tables to Driverless AI, connect your workflow to the “Send to Driverless AI” node: Right-click the node and select Configure… from the context menu.

    Combining the power of KNIME and H2O.ai in a single workflow

    Figure 9: Example workflow to push data from KNIME Analytics Platform to H2O Driverless AI

    Before you push the data to Driverless AI you need to configure the connection.

    Combining the power of KNIME and H2O.ai in a single workflow

    Fig. 10 Configuring the connection to H2O Driverless AI

    After you send the data to Driverless AI you can right click the “Send to Driverless AI” node and select “Interactive View: H2O Driverless AI Experiment View” to bring up the Driverless AI and use this interface to build an experiment, view AutoReport and generation Machine Learning Interpretability (MLI) metrics and graphs.

    Combining the power of KNIME and H2O.ai in a single workflow

    Fig. 11 Opening the interactive view to bring up the Driverless AI and use this interface to build an experiment, view AutoReport and generation Machine Learning Interpretability (MLI) metrics and graphs.

    Below is what the Driverless AI UI looks like within KNIME

    Combining the power of KNIME and H2O.ai in a single workflow

    Fig. 12 H2O Driverless AI user interface in KNIME

    Step 5: Deploy Model and Score New Data

    KNIME can build Machine Learning production workflows to consume the models that were trained. H2O.ai provides production ready low latency models and pipelines in the MOJO deployment artifact. MOJO (stands for Model Object, Optimized) is a standalone, low-latency model object designed to be easily embeddable in production environments. Add an H2O Driverless AI MOJO Predictor node to score data within a KNIME Workflow via drag and drop interface.

    Combining the power of KNIME and H2O.ai in a single workflow

    Conclusion

    The expanded integration between H2O.ai and KNIME brings together all-encompassing, intuitive, automated machine learning from H2O.ai with the guided analytics from KNIME. Customers of H2O.ai and KNIME can now:

    • Develop an integrated data science workflow in KNIME Analytics Platform and KNIME Server, from data discovery, data preparation to production-ready predictive models
    • Deliver the power of automatic machine learning to business analysts, enabling more citizen data scientists with H2O Driverless AI
    • Reduce model deployment times, leveraging H2O Driverless AI and KNIME Server for reliably managing workflow, the model creation process, and production deployment

    Additional Resources

    Blog Articles

    KNIME H2O.ai Extensions

    KNIME Example Workflow

    Community

    Docs

    Partner Pages

    Paul Treichler &  Stephen Rauner

    Will They Blend? MDF meets Apache Kafka. How's the engine doing?

    $
    0
    0
    Will They Blend? MDF meets Apache Kafka. How's the engine doing?Anonymous (not verified)Mon, 10/19/2020 - 10:00

    In this blog series we experiment with the most interesting blends of data and tools. Whether it’s mixing traditional sources with modern data lakes, open-source devops on the cloud with protected internal legacy tools, SQL with noSQL, web-wisdom-of-the-crowd with in-house handwritten notes, or IoT sensor data with idle chatting, we’re curious to find out: will they blend? Want to find out what happens when IBM Watson meets Google News, Hadoop Hive meets Excel, R meets Python, or MS Word meets MongoDB?

    Follow us here and send us your ideas for the next data blending challenge you’d like to see at willtheyblend@knime.com.

    An Automotive Challenge

    In today’s challenge we are driving around the automotive world, experimenting with measurement data. Our new engine is undergoing tests and we want to compare its performances with the temperature reached. A very sophisticated and standardized sensor measures the speed of the motor and the turbine, producing an MDF file with the measurements. At the same time, another sensor keeps track of the temperature publishing those values on a Kafka Topic. How can we merge and compare these different data?

    Introducing MDF and Apache Kafka

    MDF

    MDF was originally developed as a proprietary format for the automotive industry. Thanks to its stability and versatility, in 2009 a new ASAM working group released the first standardised version of the ASAM MDF file format, since then adopted as standard de facto in the field of measurement and calibration. It allows easy store and read measurements data and the related meta information.

    Apache Kafka

    Apache Kafka is an open source streaming platform able to deal with real time data feeds. Many sensor devices (called Producer) can be configured to publish their measurement data regarding a certain Topic to a Kafka Cluster. The data will then be read by the Consumers subscribed to that topic. If you are interested, here is a complete overview of the Kafka world. 

    In an ideal world...

    ...all our devices would speak the same language and be able to communicate with each other. But if you have ever worked with raw sensor data you would probably know that this is not the case: different sampling rates, data formats, ranges, units of measurement… There are many differences within the data that can make this process tricky and unfunny.

    Luckily, with KNIME Analytics Platform this becomes a child’s play!

    Topic. Analyze automotive related sensor data 

    Challenge. Blend sensor measurements in MDF file format and from a Kafka Cluster

    Access Mode. KNIME MDF Integration and KNIME Extension for Apache Kafka (Preview)

    The Experiment

    First, let’s focus on the MDF measurements. In order to read the sample.mdf file attached to the workflow, we use the new MDF Reader node. The node comes with the KNIME MDF Integration that you can download from the KNIME Hub.

    This node is based on the asammdf Python library, therefore you will need to set up the KNIME Python Integration. Refer to the KNIME Python Integration Installation Guide for more details.

    The MDF Reader node offers a variety of settings to deal with the MDF file format:

    • In the option tab of the configuration window, select the MDF file (you can use absolute or relative path)
    • In the Channel Selection menu mark the channels that you want to focus on.

    In this example we will read both channels available. MDF file is organized in binary blocks, and a channel is a binary block that stores information about the measured signal and how the signal values are stored. Another important binary block is the data block that contains the signal values. 

    Move to the Advanced Settings tab and explore further options:

    • Resampling: measurements from different channels might not have the same sampling rates and offset. This option will do the resampling for us. You can choose the interpolation method - linear or previous value - and the channel’s timestamp on which the resampling will be performed. Otherwise you can define your own sampling rate. The temperature data that we are going to read later are sampled every 0.01 seconds. Therefore let’s configure the MDF node to resample at this specific interval as shown in Figure 1.
    • Cutting: only data within the specified time interval will be read.
    • Chunking: only read the specified amount of measurements. This is useful when the file does not completely fit into the main memory. 
    MDF meets Apache Kafka. How's the Engine Doing?

    Figure 1. Advanced settings of the MDF Reader node

    The second part of our measurements - regarding the temperature of the engine - are sent by the sensor to a Kafka Cluster. KNIME Analytics Platform supports this technology thanks to the KNIME Extension for Apache Kafka (Preview). The Kafka Connector node will establish a connection with the Kafka Cluster.

    Let’s append a Kafka Consumer node to read the data published to the topic “knimeTest” as shown in Figure 2. This node is also configurable to read a maximum number of entries (Kafka calls them messages) or stop reading at a custom time. 

    NOTE: the temperature data provided with this workflow have been synthetically generated.

    As previously mentioned, these temperature measurements have been recorded at intervals of 0.01 seconds. Since the time offsets match and the MDF Reader node has already performed the resampling of the data...we are ready to blend!

    MDF meets Apache Kafka. How's the Engine Doing?

    Figure 2. Configuration window of the Kafka Consumer node.

    Blending MDF Data with Data from a Kafka Cluster

    The Joiner node in the workflow in Figure 3 will merge the data from the two sources according to the time offset value. Please note that because of the resampling, we don’t have the exact measurement value for each timestamp but its approximation generated by linear interpolation.

    Figure 3. Final workflow blending MDF and Apache Kafka measurement data. Download the MDF meets Apache Kafka workflow from the KNIME Hub.

    Figure 4 shows the Line Plot of the measurements. The green and yellow lines above with more fluctuation show the motor and turbine speed. The red line below shows slight increments of the temperature after the phases of higher motor/turbine speed.

    Figure 4. Line plot of the measurements. The values from the different sources have been resampled and joined on the same time offset.

    The Results

    Yes, they blend! 

    We navigated the block structure of an MDF file and the different pieces of the Kafka Cluster using the dedicated nodes for these two data sources, and ended up with sensor measurements in a KNIME table representation. Our result tables contain time offsets values and the corresponding motor/turbine speed values, as well as the temperature values - easy to blend, visualize, and compare in KNIME. 

    Blog
    Image
    MDF meets Apache Kafka. How's the Engine Doing?
    Image style
    Fullwidth
    Emilio Silvestri
    Viewing all 561 articles
    Browse latest View live